
Graphs of Logarithmic Functions by Alex CHIK
Loading the math board and drawing, please wait…
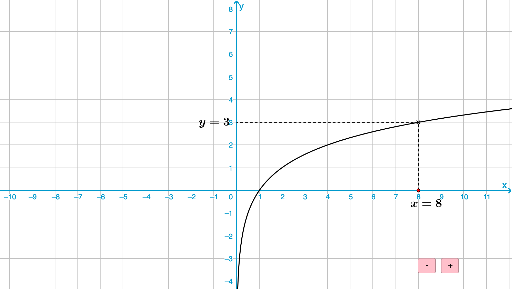
This example demonstrates the graphs of logarithmic functions and their properties. Key math concepts include the definition of logarithmic functions, graph characteristics (such as asymptotes and monotonicity), and the effect of the base on the graph. Construction highlights the use of GeoGebra commands and objects like Point, DynamicCoordinates, Segment, Mirror to dynamically display the function graph and related elements. Suitable for high school students learning about the graphs and properties of logarithmic functions, as well as transformations of function graphs.
GeoGebra Commands & Parameters
Point(xAxis) → A2DynamicCoordinates(A2, round((x(A2) * 10)) / 10, round((y(A2) * 10)) / 10) → ASegment(A, B) → bSegment(B, C) → cMirror(A, L) → A'_1Mirror(A, L) → A'_2Mirror(B, L) → B'_1Mirror(C, L) → C'Segment(B'_1, C') → c'Mirror(A, L) → A'Mirror(B, L) → B'Segment(A', B') → b'