
Graphs of Exponential Functions by megan.puckett
Loading the math board and drawing, please wait…
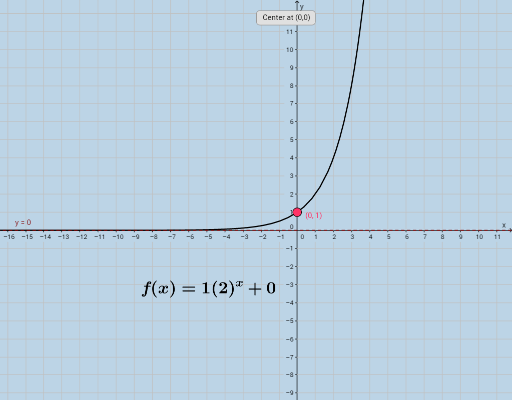
This example demonstrates the graphs of exponential functions. It involves key mathematical concepts such as exponential functions, natural numbers, and exponents. Using GeoGebra commands like Textfield, objects a, k, c, d, button1, InputBox1, InputBox2, InputBox3, InputBox5, g, f, A, text1, text2, text3, text4, text5, users can dynamically adjust parameters to observe changes in the graph of the exponential function. Suitable for high school mathematics education and learning.
GeoGebra Commands & Parameters
Textfield(a) → InputBox1Textfield(c) → InputBox2Textfield(k) → InputBox3Textfield(d) → InputBox5
AI Drawing Prompt Reference
Create a dynamic graph of an exponential function in a coordinate plane. The graph shows a curve that changes shape and position based on four adjustable parameters: base, vertical stretch, horizontal shift, and vertical shift. Include four input boxes for these parameters, allowing real-time updates of the curve. Also display the function expression and key points to illustrate growth or decay behavior. The design should be clean and suitable for high school math education.
The prompt above was compiled from the original drawing commands and is for reference only.