
Graphs of Common Probability Distributions
Loading the math board and drawing, please wait…
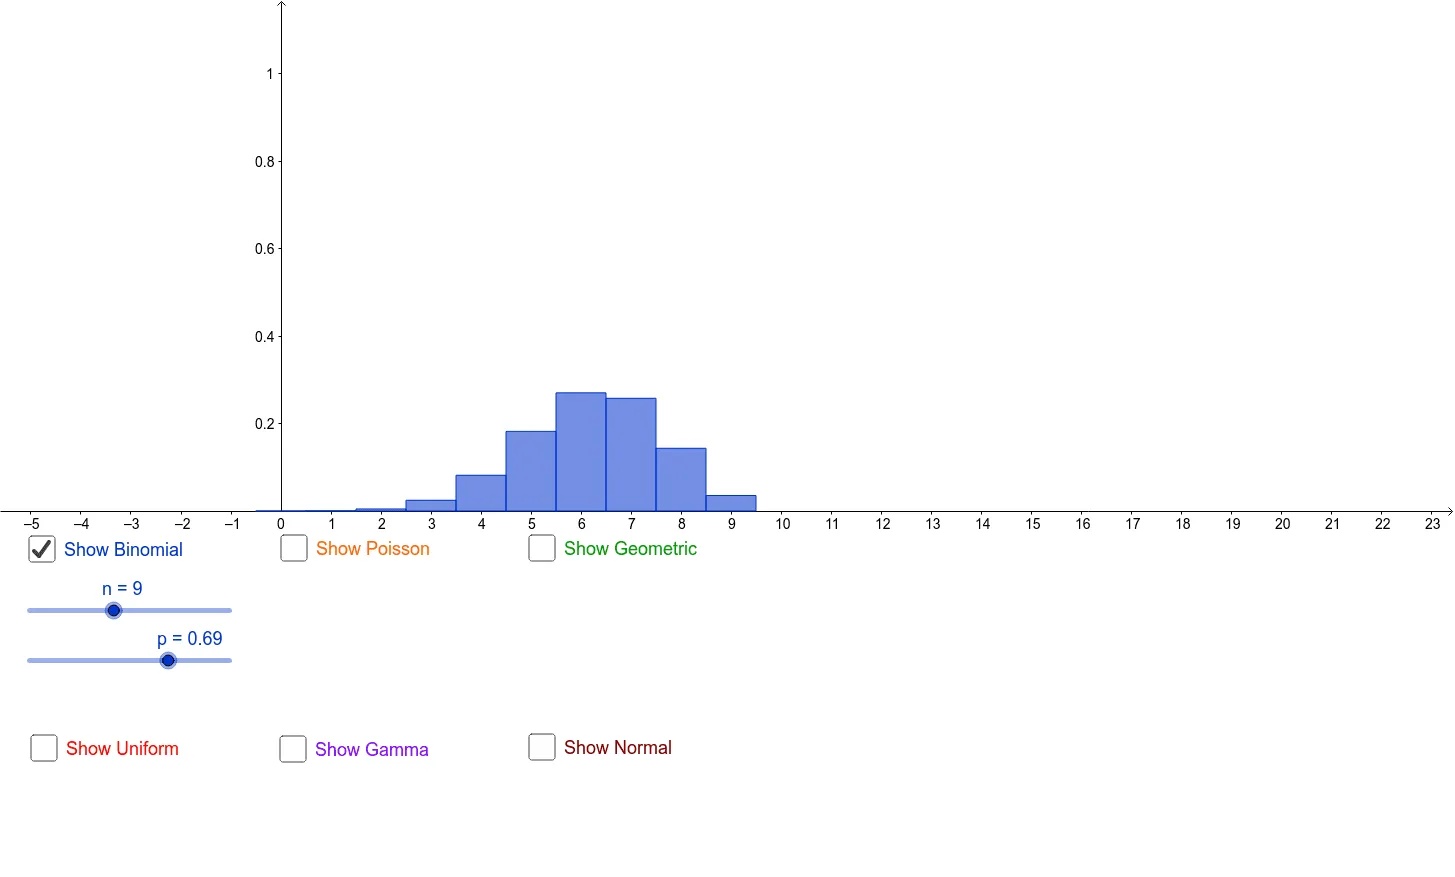
This example demonstrates the graphs of probability functions for common distributions. It involves core math concepts like probability distributions, derivatives, and integrals. Constructed using GeoGebra commands such as BinomialDist, Poisson, Histogram, Uniform, Gamma, Normal, Integral, and objects like n, p, m, A1-A20, B1-B20. Suitable for high school students and math enthusiasts studying probability and statistics.
GeoGebra Commands & Parameters
BinomialDist(n, p, false) → binomialPoisson(m, false) → poissonHistogram(geombound, geomheight) → geometricUniform(a, b, x, false) → fGamma(α, β, x, false) → gNormal(μ, σ, x, false) → hIntegral(jb, 0, 1000, true) → gammabbetaIntegral(ja, 0, 1000, true) → gammaabetaIntegral(jab, 0, 1000, true) → gammaabbeta
AI Drawing Prompt Reference
Plot the graphs of common probability distributions including binomial, Poisson, geometric, uniform, gamma, and normal distributions. Use a histogram to represent the geometric distribution and compute three integrals to show the relationships of gamma distribution with different parameters, all within the same coordinate system.
The prompt above was compiled from the original drawing commands and is for reference only.