
Graphing the Absolute Value Function
Loading the math board and drawing, please wait…
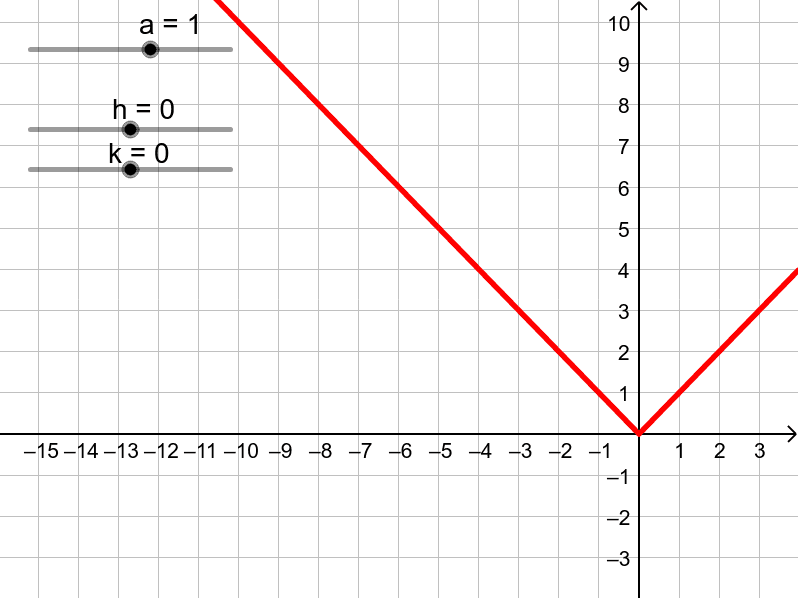
This activity explores the graph of the absolute value function. The absolute value function is a common elementary function with a V-shaped graph. By adjusting parameters a, h, and k, you can observe changes in the function's graph. This activity uses GeoGebra objects a, h, k, and f, suitable for middle school and above students to learn about function graphs and transformations.
GeoGebra Commands & Parameters
Numeric a(1.0)Numeric h(0.0)Numeric k(0.0)f(x) = (a * abs(x - (-h))) + k