
Graphing Systems of Equations: Linear Functions and Hyperbolas
Loading the math board and drawing, please wait…
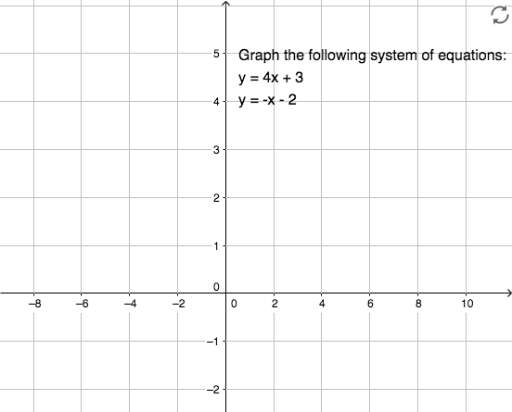
①This example demonstrates how to solve a system of equations graphically by plotting multiple equations on the same coordinate plane, showing that the solutions are the intersection points of the graphs, particularly involving linear functions and hyperbolas. ②Core mathematical concepts include the graphical method for solving systems, linear functions, hyperbolas, intersection coordinates, and the geometric meaning of the centroid (barycenter), with an extension to fractal geometry. ③Construction highlights: based on the summary, the GeoGebra construction uses a text object (text1) to label key information, likely combined with function input, implicit curve plotting, and intersection tools, allowing dynamic parameter adjustment to observe changes. ④This is suitable for high school to early college students, for integrated teaching of analytic geometry, algebra, and function graphs, as well as exploring the existence and geometric intuition of solutions to systems.
AI Drawing Prompt Reference
Draw a coordinate plane containing a system of equations with two linear functions and one hyperbola. Plot the two straight lines and the hyperbola so that they intersect at several points. Mark all intersection points clearly, as these represent the solutions to the system. Add a text label near the graph stating that solutions are the intersection points, and highlight the coordinates of each intersection. The overall layout should clearly show the relative positions of the lines and the hyperbola, making it easy to observe the number and geometric meaning of the solutions.
The prompt above was compiled from the original drawing commands and is for reference only.