
Graphing Straight Lines by Deepak M Babu
Loading the math board and drawing, please wait…
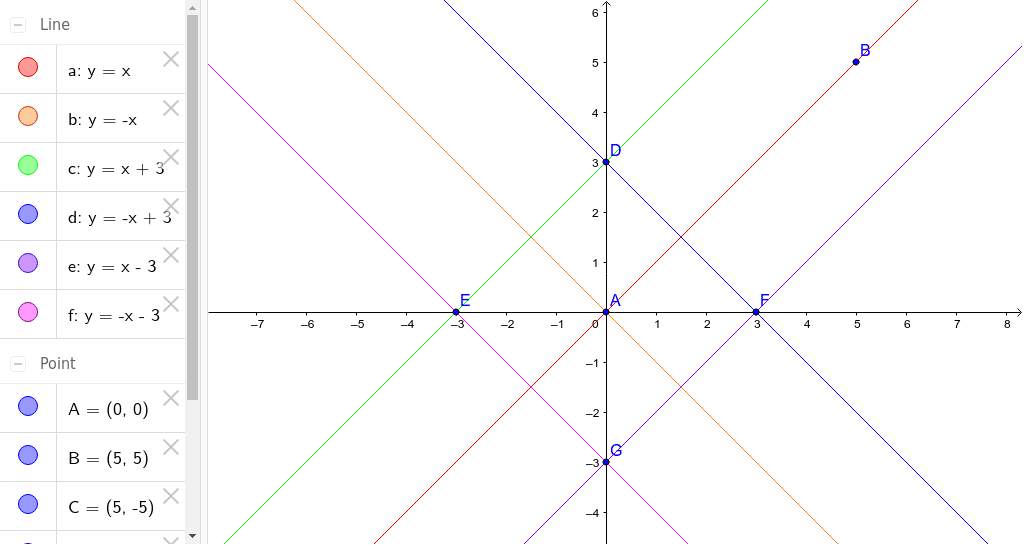
This example demonstrates how to use GeoGebra to graph straight lines. It covers basic concepts of lines, such as slope and y-intercept. Using GeoGebra commands like a, b, c, etc., you can easily construct and adjust the lines. Suitable for students in middle school and above learning coordinate geometry.
GeoGebra Commands & Parameters
Line a(-1, 1, 0)Line b(1, 1, 0)Point A(0, 0)Point B(5, 5)Point C(5, -5)Line c(-1, 1, -3)Point D(0, 3)Point E(-3, 0)Line d(1, 1, -3)Point F(3, 0)Line e(-1, 1, 3)Point G(0, -3)Line f(1, 1, 3)
AI Drawing Prompt Reference
Draw several straight lines to demonstrate basic concepts of lines, including slope and y-intercept. Start by drawing two lines passing through the origin, then draw two horizontal lines parallel to the x-axis and two vertical lines parallel to the y-axis to show different types of lines and their relationships.
The prompt above was compiled from the original drawing commands and is for reference only.