
Graphing Sinusoidal Functions
Loading the math board and drawing, please wait…
In collections
Area-Volumen-Algebra-inequalities-Trigonometric
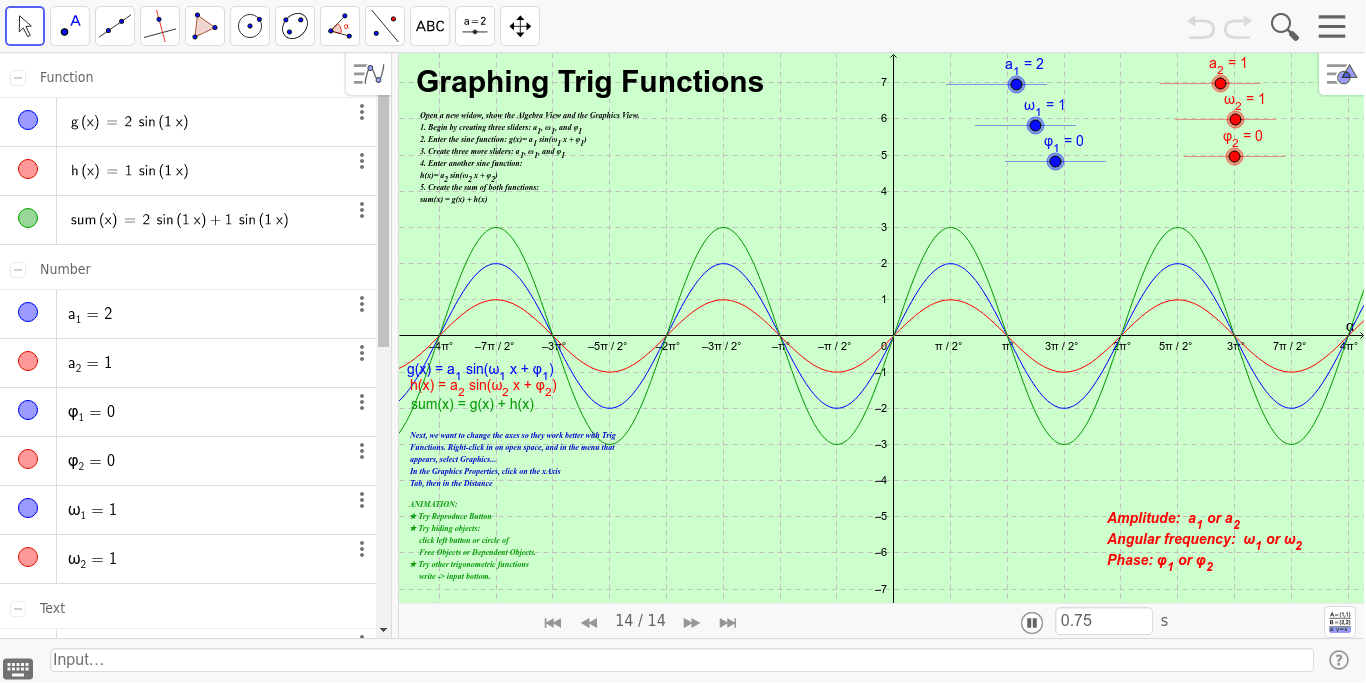
This example demonstrates how to dynamically adjust the amplitude, angular frequency, and phase shift of a sine function using sliders to observe changes in its graph. Key math concepts include trigonometric functions, function graph transformations, and parametric equations. Construction involves GeoGebra commands/objects like a_1, ω_1, φ_1, g, text1, text2, text3, texto3_1. Suitable for high school mathematics teaching to understand the geometric meaning and parameter effects of trigonometric function graphs.
GeoGebra Commands & Parameters
Numeric a_1(2.0)Numeric ω_1(1.0)Numeric φ_1(0.0)Numeric a_2(1.0)Numeric ω_2(1.0)Numeric φ_2(0.0)g(x) = a_1 * sin(ω_1 * x + φ_1)h(x) = a_2 * sin(ω_2 * x + φ_2)sum(x) = g(x) + h(x)
AI Drawing Prompt Reference
Draw an image of a sine function with dynamically adjustable amplitude, angular frequency, and phase shift, controlled by sliders to show changes in the graph. Include the sum of two sine functions and label the values of amplitude, angular frequency, and phase shift.
The prompt above was compiled from the original drawing commands and is for reference only.