
Graphing Sine & Cosine Functions in Degrees
Loading the math board and drawing, please wait…
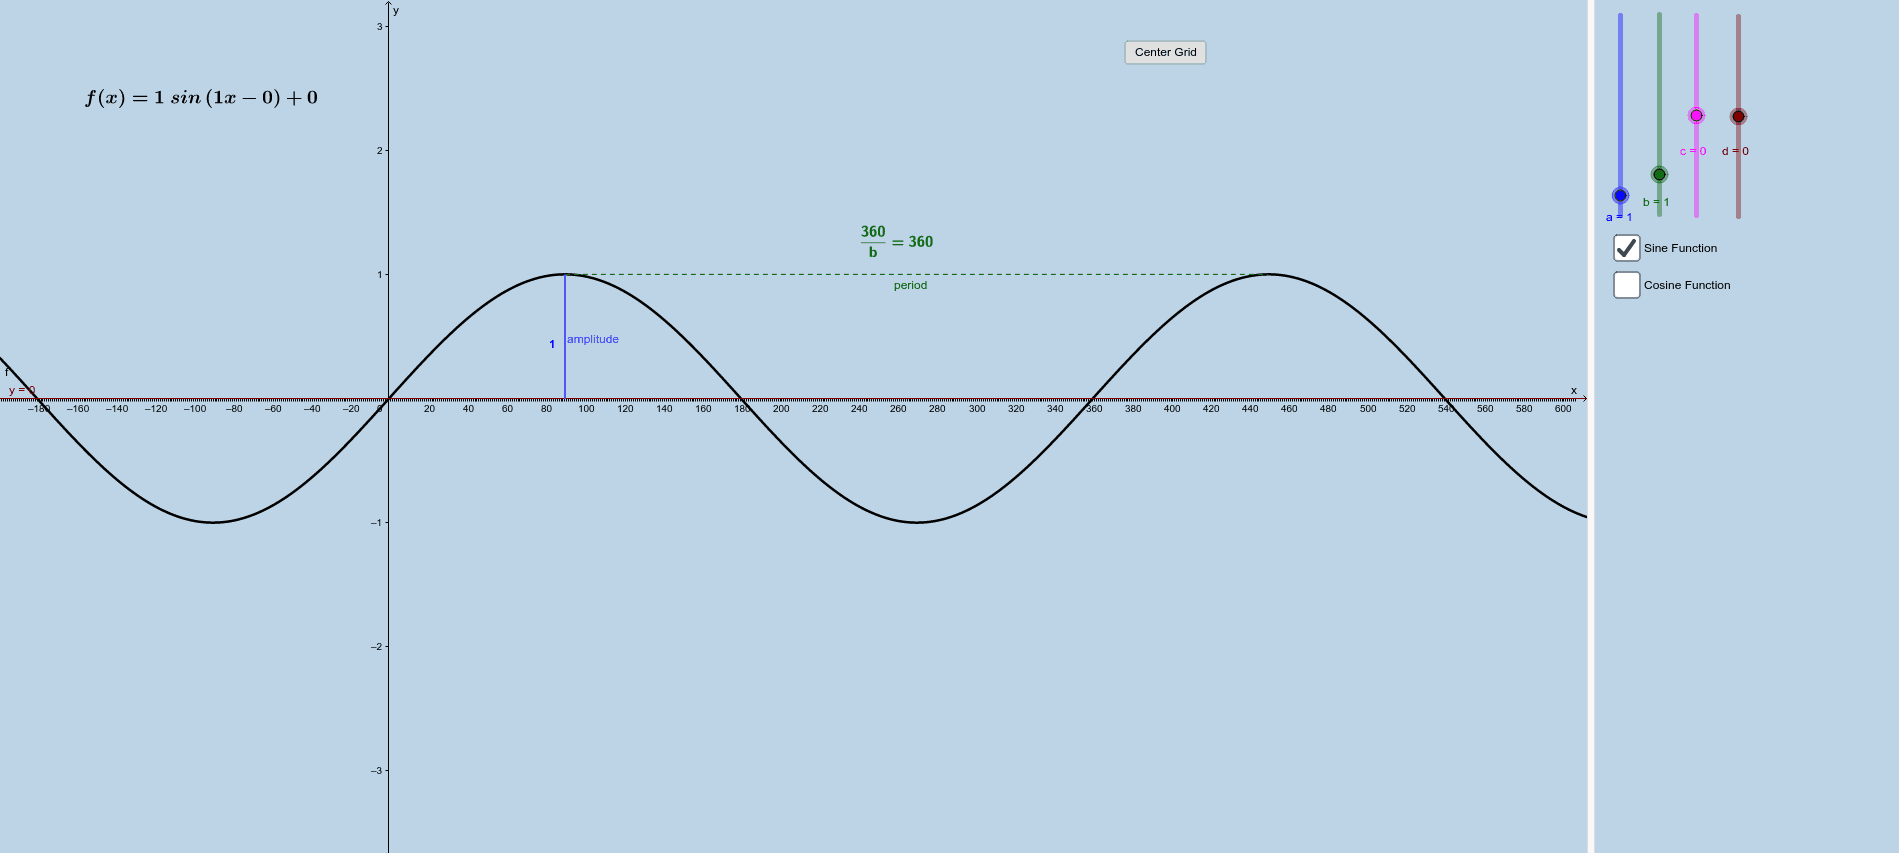
This GeoGebra example demonstrates how to graph sine and cosine functions with angles measured in degrees, visually connecting the unit circle definition to the periodic wave-like curves. The core mathematical concepts include trigonometric function graphs, periodicity, amplitude, and the relationship between degrees and radians. Construction highlights: using GeoGebra commands such as Intersect, Vector, Segment, and Distance, along with points, segments, and text objects, the construction builds a dynamic representation where an angle on the unit circle corresponds to the function value, allowing users to observe how the sine and cosine values change as the angle varies. This is suitable for high school or introductory college students learning trigonometric functions, and can be used for classroom demonstrations or self-paced exploration.
GeoGebra Commands & Parameters
Intersect(f, g, (45, 0.7071067811865475)) → CVector(B, A) → uSegment(E, D) → iDistance(E, D) → distanceEDSegment(D, F) → jDistance(D, F) → distanceDFDistance(B, A) → distanceBADistance(B, A) → lVector(K, G) → vDistance(K, G) → distanceKGDistance(K, G) → nDistance(K, G) → oDistance(G, H) → distanceGHSegment(G, H) → pIntersect(q, r) → LSegment(L, H) → sDistance(L, H) → distanceLH
AI Drawing Prompt Reference
Draw a trigonometric graph in degrees, featuring a unit circle and corresponding sine and cosine curves. Place a moving point on the unit circle, whose x- and y-coordinates represent cosine and sine values as an angle slider changes. Draw a radius segment from the center to this point, and perpendicular segments to the axes, forming a right triangle. In an adjacent coordinate system, plot sine and cosine curves with angle on the horizontal axis and function value on the vertical axis. Connect the unit circle point to the curve points with vertical segments to show the correspondence. Mark key intersection points, segment lengths, and distances to illustrate periodicity.
The prompt above was compiled from the original drawing commands and is for reference only.