
Graphing Sine and Cosine using the Unit Circle by krschreck
Loading the math board and drawing, please wait…
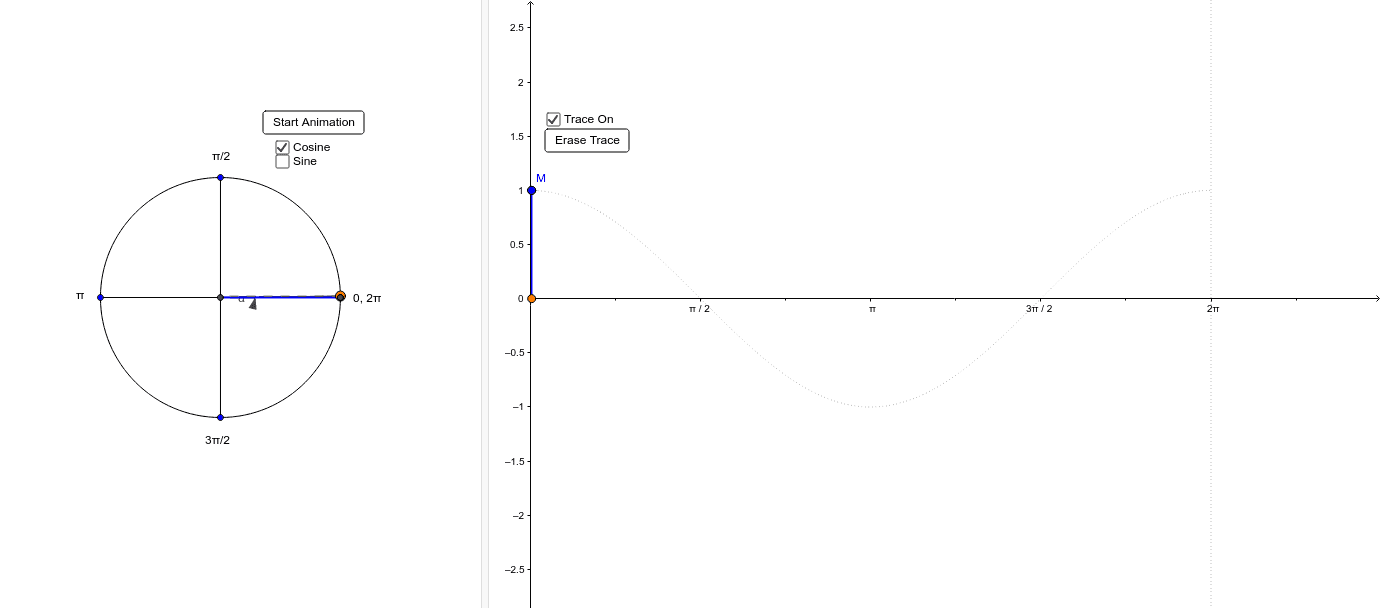
This example demonstrates how to plot sine and cosine functions using the unit circle. Key mathematical concepts include trigonometry, periodicity, and phase relationships. Construction involves GeoGebra commands like Intersect, Circle, and Point. Suitable for high school students learning trigonometric functions or for educational demonstrations.
GeoGebra Commands & Parameters
Intersect(xAxis, yAxis) → ACircle(A, 1) → cPoint(c) → BSegment(A, B) → aAngle(C, A, B) → αSegment(D, F) → bSegment(E, C) → dIf(0 ≤ x ≤ 6.28319, sin(x)) → fIf(0 ≤ x ≤ 6.28319, cos(x)) → gSegment(A, G) → eSegment(B, G) → hSegment(B, H) → iSegment(J, I) → jSegment(I, L) → kSegment(B, G) → p
AI Drawing Prompt Reference
Draw a graph of sine and cosine functions using the unit circle. Key objects include the unit circle, its center, points on the circle, and sine and cosine curves. The sine and cosine curves are generated from the circle through angle relationships, starting from the center and extending outward. The construction order is to first draw the unit circle, then determine the center and points on the circle, and finally draw the sine and cosine curves to ensure they correspond correctly on the circle.
The prompt above was compiled from the original drawing commands and is for reference only.