
Graphing Quadratic Functions Using Transformations
Loading the math board and drawing, please wait…
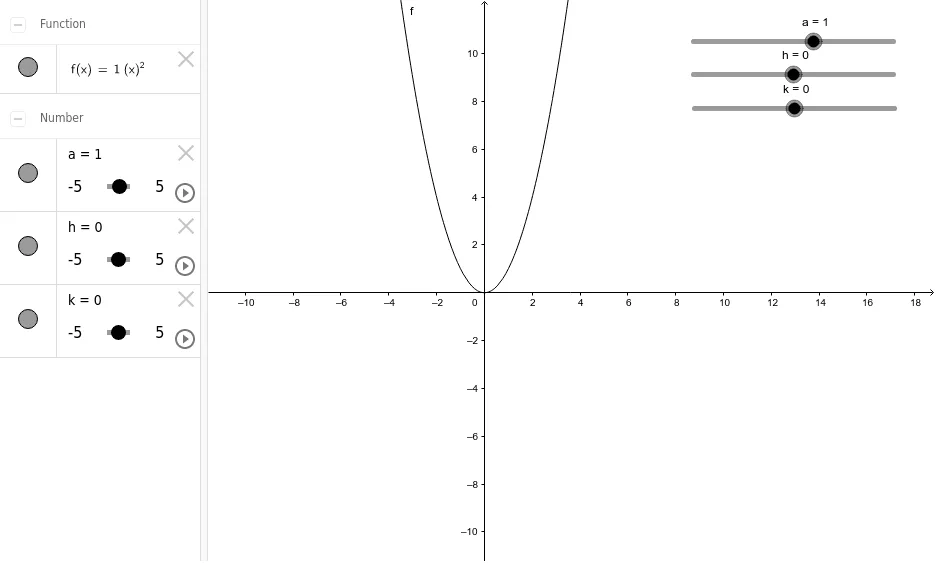
This example demonstrates how to graph quadratic functions by applying transformations to the vertex form f(x)=a(x-h)^2+k. The core mathematical concepts covered include quadratic functions, parabolas, vertex, axis of symmetry, vertical and horizontal translations, vertical stretch and compression, and reflection across the x-axis. The construction relies on GeoGebra objects a, h, k and f: a, h, and k are implemented as sliders that control the coefficients and vertex coordinates of the quadratic function f, while changing the slider values updates the graph in real time to illustrate the effect of each transformation. It is suitable for middle school and high school mathematics instruction, classroom demonstrations, and student-centered exploration of the relationship between algebraic expressions and function graphs.
GeoGebra Commands & Parameters
Numeric a(1.0)Numeric h(0.0)Numeric k(0.0)f(x) = (a * (x - h)^(2)) + k
AI Drawing Prompt Reference
Draw a parabola graph. The vertex of the parabola is at (h, k). The direction of the opening is determined by the coefficient a. a controls the stretch or compression of the parabola, h controls the horizontal translation, and k controls the vertical translation. Draw the graph by first setting the vertex position, then adjusting the coefficient to change the shape of the parabola. Ensure the graph is clear and shows the relationship between the parabola and the axes.
The prompt above was compiled from the original drawing commands and is for reference only.