
Graphing Quadratic Functions - Standard Form 3: Find y-intercept, Axis of Symmet
Loading the math board and drawing, please wait…
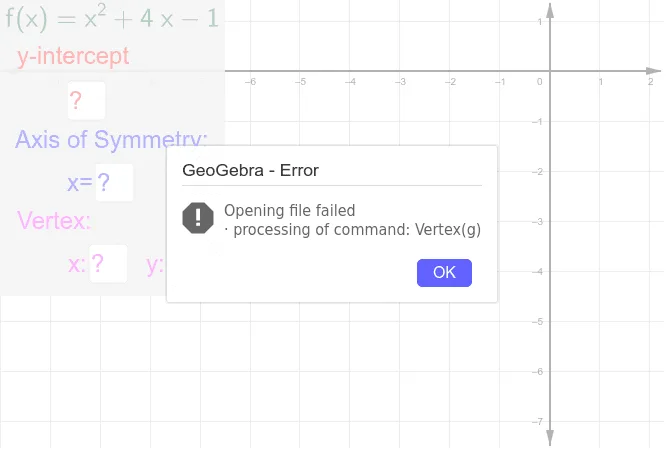
This interactive GeoGebra example asks students to type in the y-intercept, axis of symmetry, and vertex of a given quadratic function in standard form (y = ax² + bx + c), with immediate visual verification on the graph. The core mathematical concepts include the characteristics of quadratic function graphs, the symmetry of parabolas, the vertex formula, and the geometric meaning of the y-intercept. Construction details: the example uses Textfield commands to create input boxes, the Vertex command to mark the parabola's vertex, and Polygon to construct auxiliary shapes (such as reference triangles on the axis of symmetry), linking multiple objects (f, text1, a, b, inputBox1, etc.) for dynamic feedback. Suitable for upper middle school or lower high school students, this resource reinforces understanding of quadratic graph properties and serves as an engaging classroom exercise or self-paced exploration tool.
GeoGebra Commands & Parameters
Textfield(a) → inputBox1Textfield(b) → inputBox2Textfield(c) → inputBox3Textfield(d) → inputBox4Vertex(g) → B, , ,Polygon(G, H, I, J) → poly1, g_1, h, i, j