
Graphing Quadratic Functions - Standard Form 1 by Thomas Gebbie
Loading the math board and drawing, please wait…
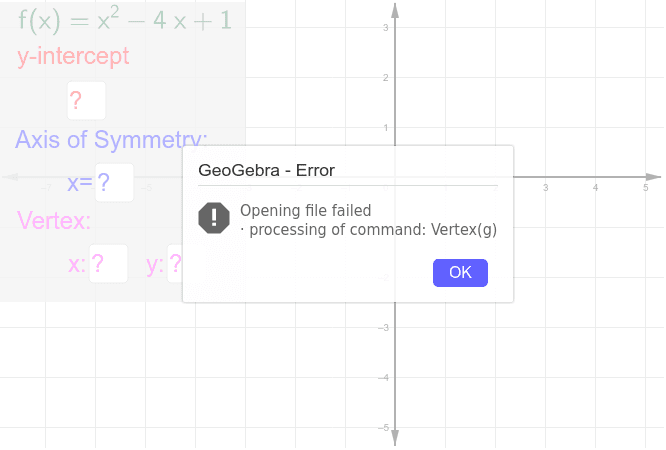
This example demonstrates how to graph quadratic functions in standard form, asking students to input the y-intercept, axis of symmetry, and vertex. Key math concepts include quadratic functions, vertex, axis of symmetry, and y-intercept. Construction highlights: uses Textfield for input boxes, Vertex for vertex coordinates, and Polygon for geometric shapes. Suitable for high school students learning to graph and analyze quadratic function properties.
GeoGebra Commands & Parameters
Textfield(a) → inputBox1Textfield(b) → inputBox2Textfield(c) → inputBox3Textfield(d) → inputBox4Vertex(g) → B, , ,Polygon(C, D, E, F) → poly1, c_1, d_1, e_1, f_1
AI Drawing Prompt Reference
Create a graph demonstrating how to plot quadratic functions in standard form, with input boxes for the y-intercept, axis of symmetry, and vertex, showing vertex coordinates and a geometric shape formed by these points, suitable for high school students learning quadratic function properties.
The prompt above was compiled from the original drawing commands and is for reference only.