
Graphing Quadratic Functions - Intercept Form 1 by Thomas Gebbie
Loading the math board and drawing, please wait…
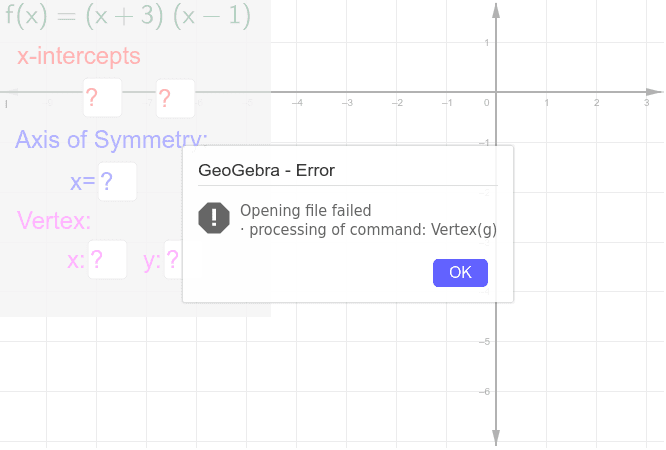
①This example demonstrates a quadratic function in intercept form, where students are asked to type in the y-intercept, axis of symmetry, and vertex of the given parabola. ②Core math concepts include the intercept form y=a(x-p)(x-q), the y-intercept (value at x=0), the axis of symmetry (vertical line through the midpoint of the roots), and the vertex (point on the axis of symmetry). ③Construction details: GeoGebra commands such as Textfield create input boxes, Vertex computes the vertex, Polygon and Intersect build auxiliary shapes and intersection points; multiple text objects (text1 to text5) guide student input. Objects include m, e, f, a, b, c, d, g, h, i, j, k, l, points A through M, and polygon poly1. ④Suitable for upper middle school or lower high school students learning quadratic function properties, and useful for interactive classroom practice or self-study to connect algebraic forms with graphical features.
GeoGebra Commands & Parameters
Textfield(a) → inputBox1Textfield(b) → inputBox2Textfield(c) → inputBox3Textfield(d) → inputBox4Vertex(g) → B, , ,Polygon(G, H, I, J) → poly1, g_1, h, i, jTextfield(k) → inputBox5Intersect(f, l, 1) → AIntersect(f, l, 2) → K
AI Drawing Prompt Reference
Draw a quadratic function graph in intercept form, showing a parabola opening upward with two x-intercepts. Place five input boxes in the coordinate plane for entering the y-intercept, axis of symmetry, and vertex coordinates. Mark the axis of symmetry with a dashed vertical line and indicate the vertex point. Use a polygon to outline the region bounded by the parabola and the axes, and label the two intersection points with the x-axis. Add text prompts guiding students to fill in the values.
The prompt above was compiled from the original drawing commands and is for reference only.