
Graphing Quadratic Functions by Sabrina Hochman
Loading the math board and drawing, please wait…
In collections
Maths and Statistics Support
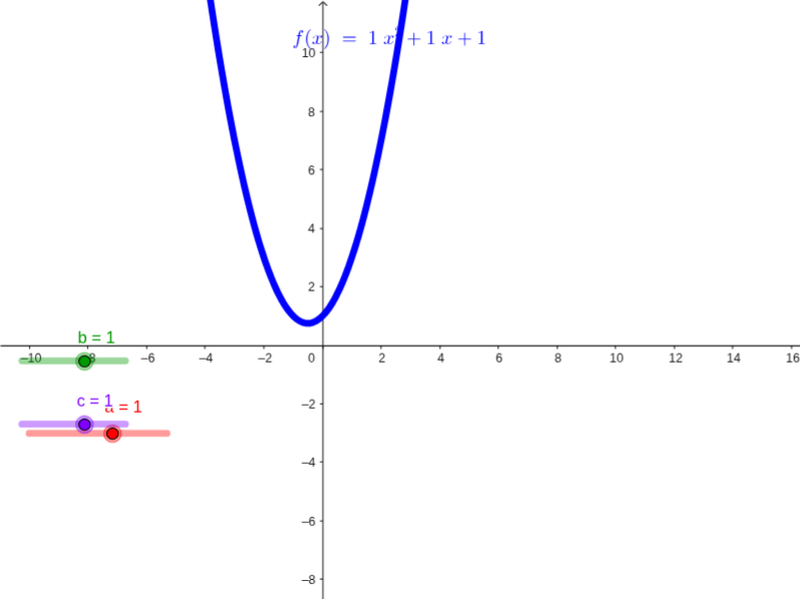
This example demonstrates how to observe changes in the quadratic function's graph by altering coefficients a, b, and c, including the direction of the parabola, vertex position, and axis of symmetry. Key math concepts include quadratic functions, vertex form, axis of symmetry, and discriminant. It uses GeoGebra commands Intersect and objects a, b, c, f, A, B for construction. Suitable for high school students learning the properties of quadratic function graphs and the impact of parameters.
GeoGebra Commands & Parameters
Intersect(f, xAxis, 1) → AIntersect(f, xAxis, 2) → B
AI Drawing Prompt Reference
Draw the graph of a quadratic function and show how changes in coefficients affect the graph, including the direction of the parabola, vertex position, and axis of symmetry. First, find the two intersection points of the function graph with the x-axis, then connect these points, and label the vertex.
The prompt above was compiled from the original drawing commands and is for reference only.