
Graphing Quadratic Functions by Morgan Brauer
Loading the math board and drawing, please wait…
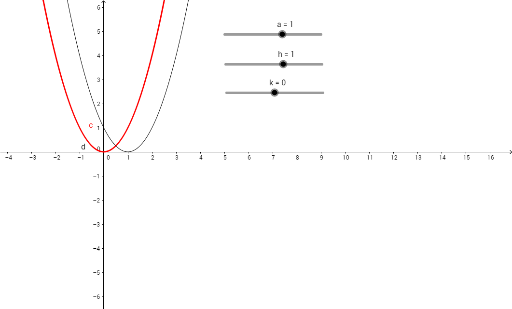
This example demonstrates how to graph and dynamically adjust the quadratic function y=a(x-h)²+k. It involves core math concepts like quadratic functions, vertex form, and the impact of parameters a/h/k on the graph's shape and position. Construction highlights include Geogebra commands/objects: object c (curve), a (slider), h (slider), k (slider), d (point). Suitable for high school mathematics teaching to understand the characteristics of quadratic function graphs and the effects of parameter changes.
GeoGebra Commands & Parameters
y = x^(2)Numeric a(1)Numeric h(1)Numeric k(0)y = (a * (x - h)^(2)) + k