
Graphing Quadratic Equations Example
Loading the math board and drawing, please wait…
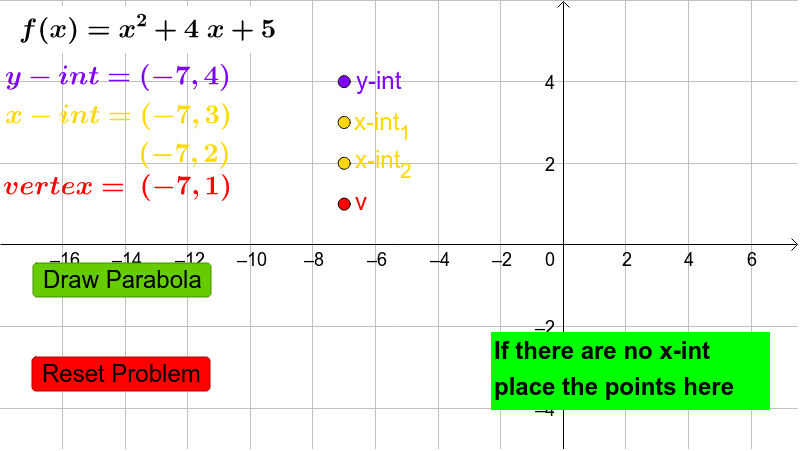
This example demonstrates how to graph quadratic equations using GeoGebra, focusing on key features like coefficients, vertex, discriminant, and intersection points. It involves commands such as Coefficients, If, and Textfield, along with objects like f, Coeff, h, k, disc, x1, x2, and interactive elements for analysis. Ideal for high school mathematics education to explore quadratic function properties and parameter effects.
GeoGebra Commands & Parameters
Coefficients(f) → CoeffIf(disc ≥ 0, h + sqrt(disc) / 2, 1) → x1If(disc ≥ 0, h - sqrt(disc) / 2, 1) → x2Textfield(f) → InputBox1