
Graphing One Variable Inequalities
Loading the math board and drawing, please wait…
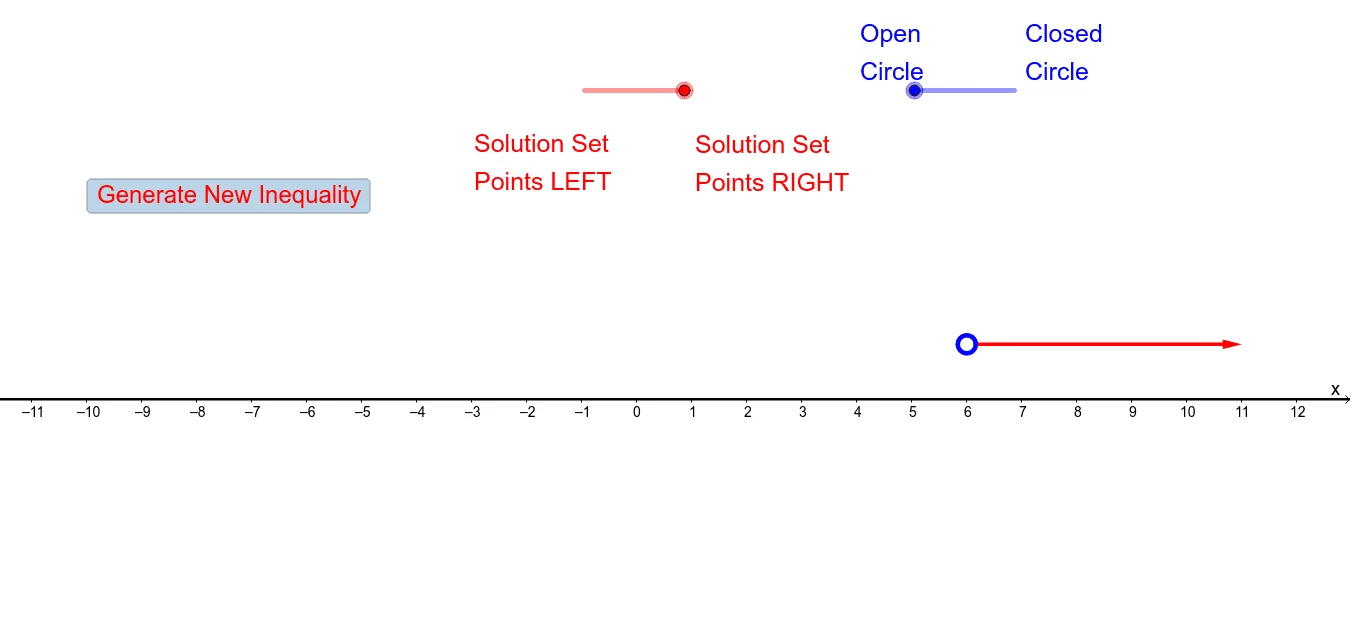
This example demonstrates the graphing of one-variable inequalities. It involves core mathematical concepts such as inequalities, median line, and mathematical analysis. The construction uses GeoGebra commands/objects like Random, Point, DynamicCoordinates, and Vector. It is suitable for high school mathematics students and teachers for understanding and teaching the plotting of inequality graphs.
GeoGebra Commands & Parameters
Random(-10, 10) → aPoint(b) → ARandom(1, 4) → eRandom(0, 1) → rDynamicCoordinates(A, round(x(A)), 1) → BVector((x(B) + 0.15, 1), (11, 1)) → uVector((x(B) - 0.15, 1), (-11, 1)) → v