
Graphing Logarithmic Functions by Mr. GriffinBanks
Loading the math board and drawing, please wait…
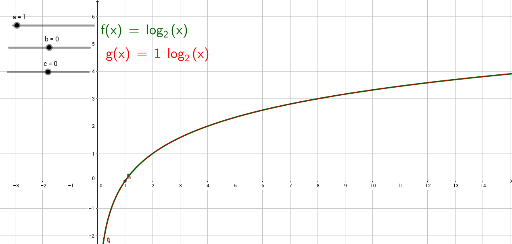
This example demonstrates how to graph logarithmic functions and analyze their properties. Key math concepts include logarithmic functions, differential calculus, and equation solving. GeoGebra commands used are LaTeX for text display, Intersect for intersection calculations, with objects like function f, texts text1 and text2, variables a, b, c, function g, and points A and B. Suitable for high school and above students to learn about logarithmic function graphs and calculus applications.
GeoGebra Commands & Parameters
LaTeX(f, true, true) → text1LaTeX(g, true, true) → text2Intersect(f, xAxis, (1, 0)) → AIntersect(g, xAxis, (1, 0)) → B