
Graphing Linear Inequalities: Demonstrating Solution Regions in Coordinate Plane
Loading the math board and drawing, please wait…
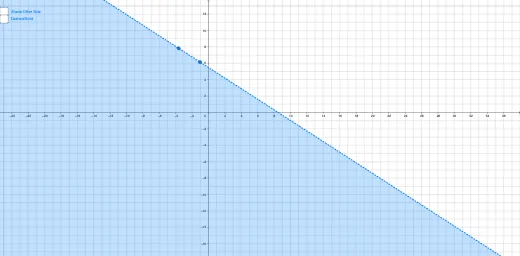
This example shows how to plot linear inequalities using GeoGebra, illustrating the geometric representation of solution sets. Key mathematical concepts include linear inequalities, region representation, and coordinate transformations. Construction involves using the Line command to define boundary lines, then applying inequality constraints to determine solution regions. Suitable for high school students learning the geometric meaning of inequality solutions, or for mathematical modeling instruction.
GeoGebra Commands & Parameters
Line(P1, P2) → a
AI Drawing Prompt Reference
Draw the lines y = 2x + 1 and y = -x + 4, then shade the regions for y > 2x + 1 and y < -x + 4 to represent their solution sets. First, draw the two lines, then apply inequality constraints to determine the shaded areas.
The prompt above was compiled from the original drawing commands and is for reference only.