
Graphing Linear Equations
Loading the math board and drawing, please wait…
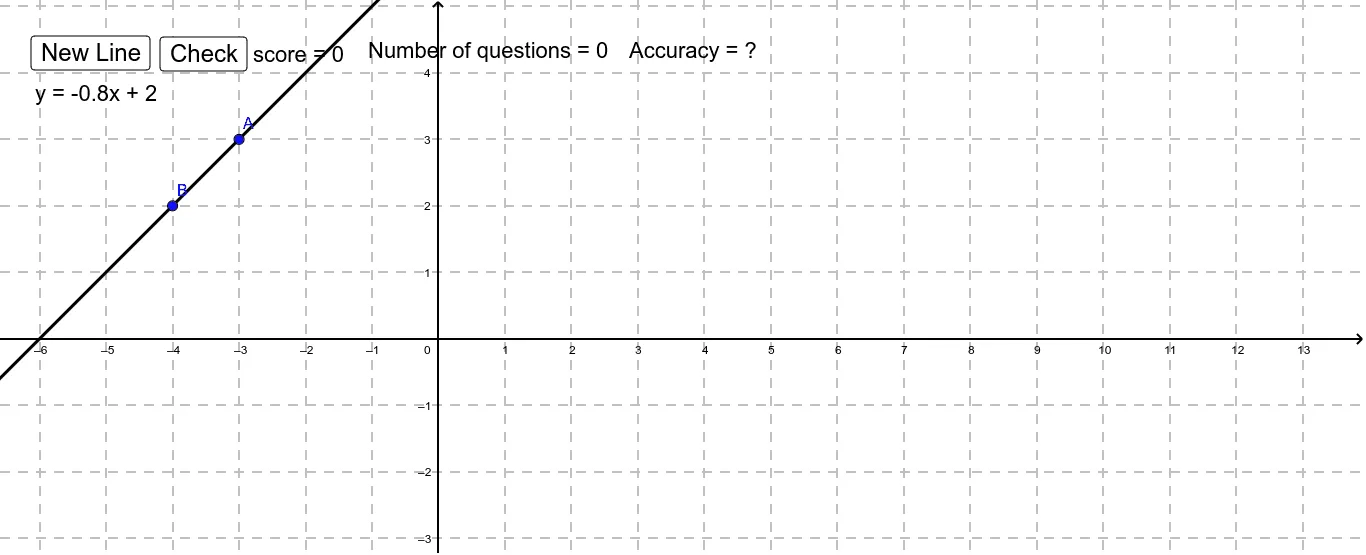
This example demonstrates how to graph linear equations in slope-intercept and standard form using GeoGebra. Key math concepts include linear equations, slope, y-intercept, and coordinate geometry. It utilizes commands like Line, RandomElement, Random, and Text, along with objects such as score, A, B, a, m, b, l1, l2, r, etc., for creating interactive visualizations. Suitable for high school students learning to plot linear equations.
GeoGebra Commands & Parameters
Line(A, B) → aRandomElement({-4, -3, -2.5, -2, -1.5, -1, -0.8, -0.75, -0.6, -0.5, -0.4, -0.25, -0.2, 0.2, 0.25, 0.4, 0.5, 0.6, 0.75, 0.8, 1, 1.5, 2, 2.5, 3, 4}) → mRandom(-5, 5) → bRandomElement({1, 2}) → rText(("score = " * score)) → text1Text(l1) → text2Text(l2) → text3Text(("Number of questions = " * problems)) → questionsText(("Accuracy = " * accu)) → accur