
Graphing Linear Equations with Slope and Intercept
Loading the math board and drawing, please wait…
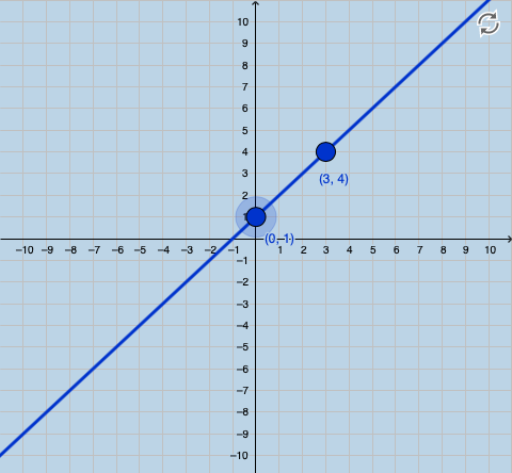
This example uses an interactive applet to demonstrate how to graph linear equations using slope and intercept. It covers the basic concepts of linear equations, including the meaning of slope and intercept. Students can see the results instantly as they input random linear equations, helping them understand the relationship between the equation and its graph. Commands used include Sequence, Union, Random, Line, and FractionText. Suitable for middle school and above students to learn the drawing and understanding of linear equations.
GeoGebra Commands & Parameters
Sequence(i, i, -10, -1) → aSequence(i, i, -10, -1) → bSequence(i, i, 1, 10) → cUnion(b, c) → dRandom(-9, 9) → eLine(A, B) → gFractionText(Slope[f]) → text1FractionText(f(0)) → text2