
Graphing Linear Equations Using Slope and Intercept
Loading the math board and drawing, please wait…
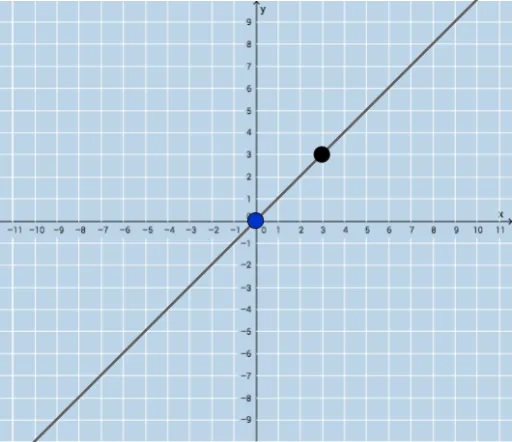
This example provides an interactive way for students to practice graphing linear equations using slope and intercept. It demonstrates how to quickly and accurately draw the graph of a linear equation based on given slope and intercept, and provides instant feedback. Commands used include Sequence, Union, Random, Point, Line, and FractionText. Suitable for middle school and above students for linear equation graphing practice.
GeoGebra Commands & Parameters
Sequence(i, i, -10, -1) → aSequence(i, i, -10, -1) → bSequence(i, i, 1, 10) → cUnion(b, c) → dRandom(-12, 12) → ePoint(x = 0) → ALine(A, B) → gFractionText(Slope[f]) → text1FractionText(f(0)) → text2