
Graphing Linear Equations Using Intercepts
Loading the math board and drawing, please wait…
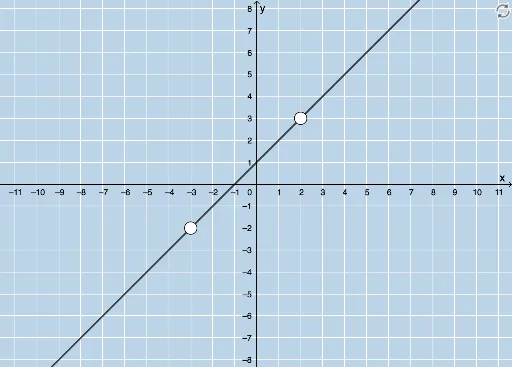
This example demonstrates how to graph linear equations written in standard form using the x and y intercepts. Key math concepts include standard form linear equations, intercepts, and coordinate geometry. It utilizes GeoGebra commands and objects like Random, LCM, Line, Textfield, Point, Circle, Intersect, and FractionText for construction. Suitable for high school students learning to plot linear equations.
GeoGebra Commands & Parameters
Random(-6, 6) → aRandom(-6, 6) → bLCM(a, b) → cRandom(1, 4) → kLine(A, B) → gTextfield(h) → InputBox1Textfield(j) → InputBox2Textfield(m) → InputBox3Point(f) → CCircle(C, 2) → pIntersect(p, f, 2) → DFractionText(h) → text6
AI Drawing Prompt Reference
Draw a coordinate-plane figure showing a line and the intersection point(s) it shares with a circle. First determine a linear equation in standard form by using two randomly chosen integers to set the line’s position. Place three editable input fields near the figure for parameters related to intercepts. Choose a point on the line (or defined as the circle’s center based on the line) and construct a circle centered at that point with a fixed radius of 2. Then find the intersection between the circle and the line and display a fraction-style text near the result to represent the intercept-related value.
The prompt above was compiled from the original drawing commands and is for reference only.