
Graphing Linear Equations in Standard Form: Integer Intercepts
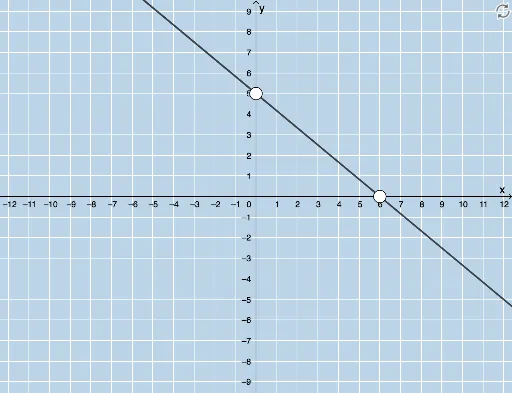
Loading the math board and drawing, please wait…
In collections
Graphing Linear Functions
This example demonstrates how to graph linear equations in standard form, focusing on the core mathematical concepts of linear equations and integer intercepts. Using GeoGebra commands such as Random, LCM, and Line, dynamic generation of different parameter linear equation graphs is achieved. Suitable for middle school and above students or teachers to help understand and master the graphical representation of linear equations.
GeoGebra Commands & Parameters
Random(-6, 6) → aRandom(-6, 6) → bLCM(a, b) → cRandom(1, 4) → kLine(A, B) → g
AI Drawing Prompt Reference
Draw a straight line on a coordinate plane, defined by a linear equation in standard form. The coefficients are two random integers between -6 and 6, and the constant term is the least common multiple of these two numbers. Then choose a random integer from 1 to 4 as a scaling factor to adjust the equation. The line should pass through two integer intercept points determined by these parameters, ensuring both x- and y-intercepts are integers. Clearly show the coordinate axes, grid lines, and the line, with the intercepts marked. Keep the layout simple to observe the line's direction and intercept features.
The prompt above was compiled from the original drawing commands and is for reference only.