
Graphing Linear Equations and Functions
Loading the math board and drawing, please wait…
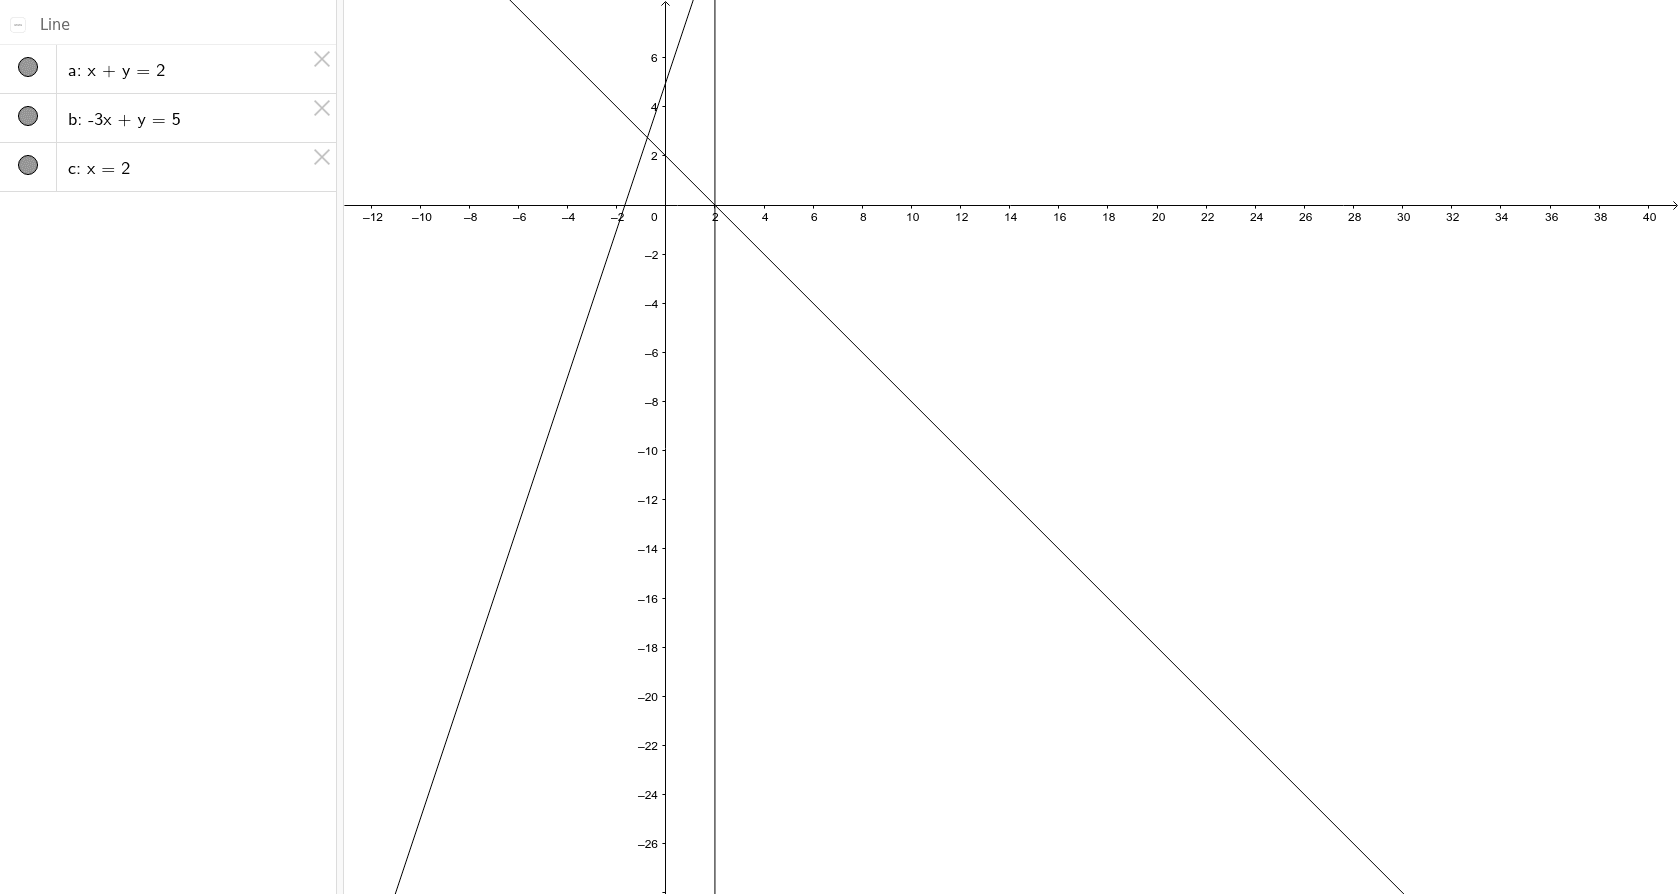
This example demonstrates how to plot linear equations and functions. Key mathematical concepts include linear equations, function graphs, and coordinate geometry. Construction involves using GeoGebra commands a, b, c for object creation. Suitable for middle or high school mathematics teaching to understand linear relationships and function representation.
GeoGebra Commands & Parameters
Line a(1, 1, -2)Line b(-6, 2, -10)Line c(1, 0, -2)
AI Drawing Prompt Reference
Draw two lines: one passing through points (1,1) and (-2,-1), and another through points (-6,2) and (-10,-2). Then draw a line passing through points (1,0) and (-2,-2). Observe the relationships and intersections between these lines.
The prompt above was compiled from the original drawing commands and is for reference only.