
Graphing Intervals
Loading the math board and drawing, please wait…
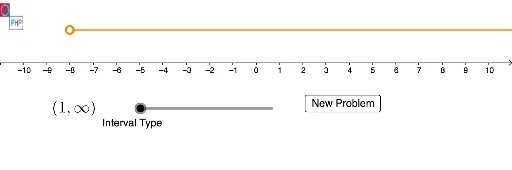
This example demonstrates how to graph intervals on a number line, including open, closed, and mixed intervals. Key math concepts involved are inequalities, number line representation, and interval notation. Construction highlights include using GeoGebra commands/objects like Random (for random endpoints), Ray (for ray representation), and Segment (for line segment visualization). Suitable for high school and university preparatory levels, ideal for teaching and visualizing solution sets of inequalities.
GeoGebra Commands & Parameters
Random(-10, 9) → aRandom(a + 1, 10) → bRandom(1, 8) → typeRay((x(A) + 0.15, 1), (20, 1)) → fRay((x(B) - 0.15, 1), (-20, 1)) → gSegment((x(A) + 0.15, 1), (x(B) - 0.15, 1)) → h