
Graphing Exponential Functions Extended Problem #3
Loading the math board and drawing, please wait…
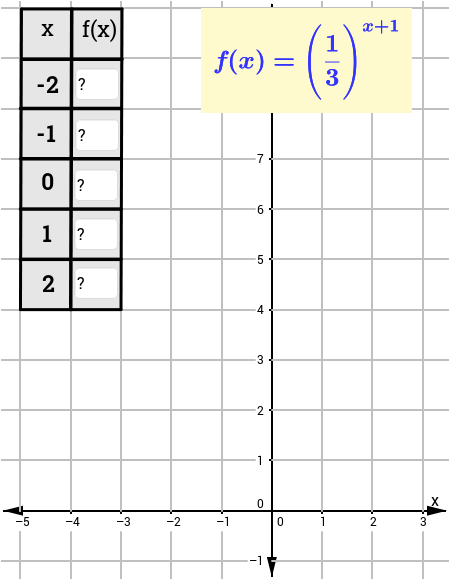
This example demonstrates how to plot exponential function graphs and verify understanding. The key mathematical concepts include properties of exponential functions, plotting function graphs on coordinate systems, and the impact of parameters on graph shape. Construction involves using GeoGebra commands such as Segment, Textfield, Polygon, Point to create function points, text annotations, and graphical elements. Suitable for middle or high school mathematics courses to practice graphing exponential functions and understanding their basic characteristics.
GeoGebra Commands & Parameters
Segment(F, S) → aSegment(H, T) → bSegment(T, S) → cSegment(H, F) → dSegment(I, J) → eTextfield(l) → inputBox1Textfield(n) → inputBox3Textfield(p) → inputBox5Textfield(q) → inputBox6Textfield(r) → inputBox7Polygon(G, M, N, L) → poly1, g, m_1, n_1, l_1Segment(K, O) → hSegment(P, W) → iSegment(R, F_1) → kSegment(U, G_1) → sSegment(V, H_1) → tSegment(I_1, J_1) → a_1Segment(K_1, L_1) → b_1Point(g) → M_1Segment(N_1, E_1) → d_1Segment(Q, E_1) → j
AI Drawing Prompt Reference
Draw a graph of an exponential function. Include a coordinate system, the function curve, and key points such as the origin, (1,1), (2,2), and (3,3). The curve should rise from left to right and pass through these points. Add text annotations like 'exponential growth'. Ensure the graph is clear with labeled axes.
The prompt above was compiled from the original drawing commands and is for reference only.