
Graphing Exponential Functions by Thomas Gebbie (6)
Loading the math board and drawing, please wait…
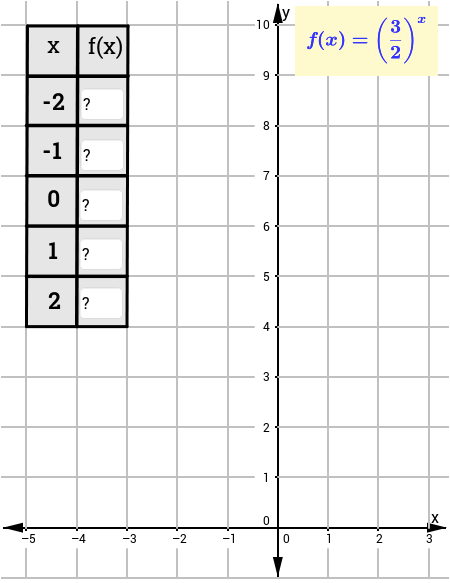
This example demonstrates how to plot exponential function graphs and check understanding. It involves core math concepts like exponential functions, graphing, and curve sketching. GeoGebra commands and objects used include Segment, Textfield, Polygon, Point for creating graphics and text. Suitable for high school mathematics teaching to help students understand and master the characteristics and properties of exponential function graphs.
GeoGebra Commands & Parameters
Segment(F, S) → aSegment(H, T) → bSegment(T, S) → cSegment(H, F) → dSegment(I, J) → eTextfield(l) → inputBox1Textfield(n) → inputBox3Textfield(p) → inputBox5Textfield(q) → inputBox6Textfield(r) → inputBox7Polygon(G, M, N, L) → poly1, g, m_1, n_1, l_1Segment(K, O) → hSegment(P, W) → iSegment(R, F_1) → kSegment(U, G_1) → sSegment(V, H_1) → tSegment(I_1, J_1) → a_1Segment(K_1, L_1) → b_1Point(g) → M_1Segment(N_1, E_1) → d_1Segment(Q, E_1) → j
AI Drawing Prompt Reference
Draw an exponential function graph with boundary lines for all four quadrants and a curve representing the function. Start by drawing the boundary lines for the quadrants, then input the function expression to generate the curve.
The prompt above was compiled from the original drawing commands and is for reference only.