
Graphing Exponential Functions #5
Loading the math board and drawing, please wait…
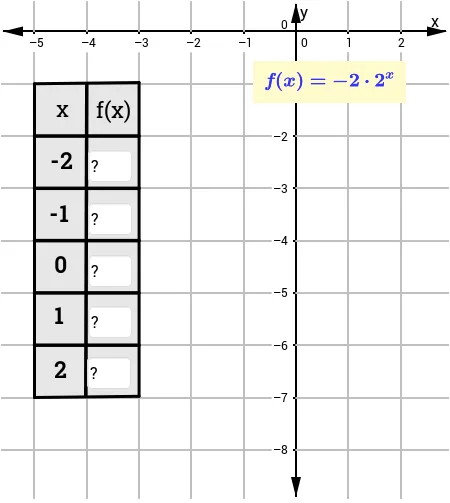
This example demonstrates plotting exponential function graphs and verifying student understanding. Key mathematical concepts include exponential function definition, logarithmic relationships, and graph characteristics. Construction involves GeoGebra commands like Segment, Textfield, Polygon, Point to build function graphs, and labeling key points. Suitable for middle or high school math classes for function graph drawing and concept understanding exercises.
GeoGebra Commands & Parameters
Segment(F, S) → aSegment(H, T) → bSegment(T, S) → cSegment(H, F) → dSegment(I, J) → eTextfield(l) → inputBox1Textfield(n) → inputBox3Textfield(p) → inputBox5Textfield(q) → inputBox6Textfield(r) → inputBox7Polygon(G, M, N, L) → poly1, g, m_1, n_1, l_1Segment(K, O) → hSegment(P, W) → iSegment(R, F_1) → kSegment(U, G_1) → sSegment(V, H_1) → tSegment(I_1, J_1) → a_1Segment(K_1, L_1) → b_1Point(g) → M_1Segment(N_1, E_1) → d_1Segment(Q, E_1) → j
AI Drawing Prompt Reference
Draw an exponential function graph, showing key points and line segments connecting, including a polygon and multiple segments, label input boxes and shapes, start by drawing basic line segments and points, then connect to form a polygon, finally add labels and input boxes to demonstrate function definition and characteristics.
The prompt above was compiled from the original drawing commands and is for reference only.