
Graphing Compound Inequalities by tmoorehead
Loading the math board and drawing, please wait…
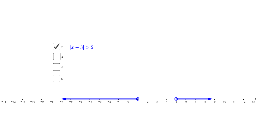
This example demonstrates how to graph the solution set of compound inequalities in a coordinate system. Key math concepts include inequalities, intersection, and coordinate geometry. It utilizes GeoGebra commands like Point, Segment, Midpoint, DynamicCoordinates, and Vector to dynamically visualize inequality boundaries and solution regions, making it suitable for high school students and educational purposes.
GeoGebra Commands & Parameters
Point(xAxis) → APoint(xAxis) → BSegment(A, B) → aMidpoint(A, B) → CSegment(C, B) → bDynamicCoordinates(A, x(A), y(A)) → DDynamicCoordinates(B, x(B), y(B)) → ESegment(D, E) → gDynamicCoordinates(A, x(A), y(A)) → FDynamicCoordinates(B, x(B), y(B)) → GPoint(xAxis) → HVector(F, H) → uVector(G, I) → vDynamicCoordinates(A, x(A), y(A)) → JDynamicCoordinates(B, x(B), y(B)) → KPoint(xAxis) → LVector(J, L) → wPoint(xAxis) → MVector(K, M) → h
AI Drawing Prompt Reference
Draw two parallel lines in a coordinate system with a segment connecting two points on the x-axis. Connect the midpoint of the segment to one endpoint. Dynamically draw a line segment through the two points on the x-axis and vectors from these points to the x-axis. Also, draw vectors from dynamic points to the x-axis to visualize the solution set of inequalities dynamically.
The prompt above was compiled from the original drawing commands and is for reference only.