
Graphing a System of Three Linear Inequalities
Loading the math board and drawing, please wait…
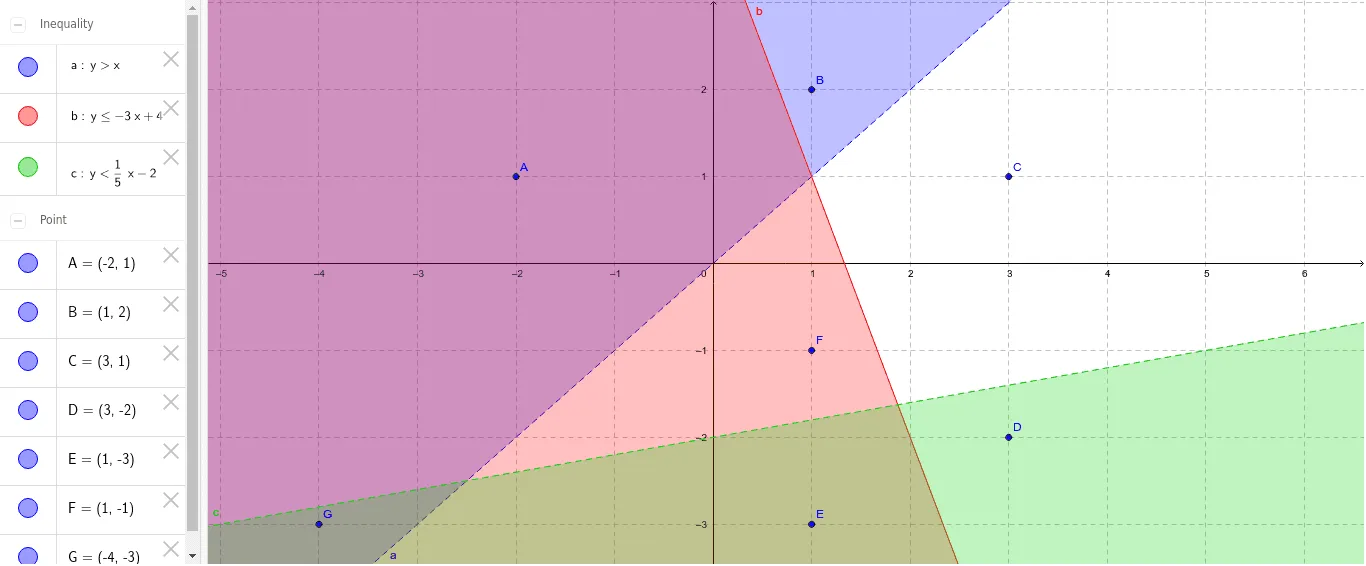
This example demonstrates how to graph three linear inequalities on the same coordinate plane, using labeled points in each region so students can substitute the point values to determine which parts of the plane satisfy the entire system. The key math concepts include linear inequalities, solution sets represented as regions, boundary-line behavior (closed vs. open boundaries), and checking feasibility by substitution. In construction, the GeoGebra setup relies on many point objects—such as a, b, c, A–G, D/E points—and systematically labeled test points (A1–A7, B1–B7, C1–C7, D1–D7, E1–E2) to place sample coordinates inside different regions for verification. This makes it well-suited for interactive learning: students evaluate the inequalities at the labeled points and infer the solution area. Suitable for middle and high school learners studying inequalities and graphing, as well as for classroom demonstrations and guided practice.
GeoGebra Commands & Parameters
a(x, y) = y > xb(x, y) = y ≤ (-3 * x) + 4c(x, y) = y < (1 / 5 * x) - 2Point A(-2.0, 1.0)Point B(1.0, 2.0)Point C(3.0, 1.0)Point D(3.0, -2.0)Point E(1.0, -3.0)Point F(1.0, -1.0)Point G(-4.0, -3.0)x(A)x(B)x(C)x(D)x(E)x(F)x(G)y(A)y(B)y(C)y(D)y(E)y(F)y(G)a(A)a(B)a(C)a(D)a(E)a(F)a(G)b(A)b(B)b(C)b(D)b(E)b(F)b(G)c(A)c(B)c(C)c(D)c(E)c(F)c(G)
AI Drawing Prompt Reference
Draw the graphs of the three linear inequalities y > x, y ≤ -3x + 4, and y < 1/5x - 2. Start by drawing the three lines, then select several points (like A, B, C, D, E, F, G) in each region to test if they satisfy the inequalities, and finally determine the solution areas based on the test results of the points.
The prompt above was compiled from the original drawing commands and is for reference only.