
Graphing a Line with Table of Values
Loading the math board and drawing, please wait…
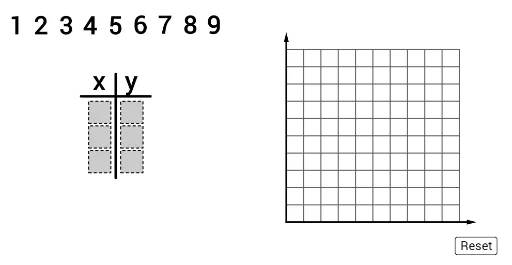
This example demonstrates how to graph a line using a table of values. Key mathematical concepts include the equation of a line in coordinate geometry. Using GeoGebra commands such as Sequence, Point, and Vector, the construction of the line and its geometric interpretation are explored. Suitable for students in middle school and above learning about linear equations and coordinate geometry.
GeoGebra Commands & Parameters
Polygon((1.3, 0), (2.2, 0), 4) → poly2Polygon((1.3, 1), (2.2, 1), 4) → poly5Polygon((0, 0), (0.9, 0), 4) → poly1Polygon((0, 1), (0.9, 1), 4) → poly4Polygon((1.3, 2), (2.2, 2), 4) → poly8Polygon((0, 2), (0.9, 2), 4) → poly7Segment(J, K) → aIf(IsInRegion[A, poly8], 1, If[IsInRegion[B, poly8], 2, If[IsInRegion[C, poly8], 3, If[IsInRegion[D, poly8], 4, If[IsInRegion[E, poly8], 5, If[IsInRegion[F, poly8], 6, If[IsInRegion[G, poly8], 7, If[IsInRegion[H, poly8], 8, If[IsInRegion[I, poly8], 9, 0]]]]]]]]) → y1If(IsInRegion[A, poly7], 1, If[IsInRegion[B, poly7], 2, If[IsInRegion[C, poly7], 3, If[IsInRegion[D, poly7], 4, If[IsInRegion[E, poly7], 5, If[IsInRegion[F, poly7], 6, If[IsInRegion[G, poly7], 7, If[IsInRegion[H, poly7], 8, If[IsInRegion[I, poly7], 9, 0]]]]]]]]) → x1If(IsInRegion[A, poly5], 1, If[IsInRegion[B, poly5], 2, If[IsInRegion[C, poly5], 3, If[IsInRegion[D, poly5], 4, If[IsInRegion[E, poly5], 5, If[IsInRegion[F, poly5], 6, If[IsInRegion[G, poly5], 7, If[IsInRegion[H, poly5], 8, If[IsInRegion[I, poly5], 9, 0]]]]]]]]) → y2If(IsInRegion[A, poly4], 1, If[IsInRegion[B, poly4], 2, If[IsInRegion[C, poly4], 3, If[IsInRegion[D, poly4], 4, If[IsInRegion[E, poly4], 5, If[IsInRegion[F, poly4], 6, If[IsInRegion[G, poly4], 7, If[IsInRegion[H, poly4], 8, If[IsInRegion[I, poly4], 9, 0]]]]]]]]) → x2If(IsInRegion[A, poly2], 1, If[IsInRegion[B, poly2], 2, If[IsInRegion[C, poly2], 3, If[IsInRegion[D, poly2], 4, If[IsInRegion[E, poly2], 5, If[IsInRegion[F, poly2], 6, If[IsInRegion[G, poly2], 7, If[IsInRegion[H, poly2], 8, If[IsInRegion[I, poly2], 9, 0]]]]]]]]) → y3If(IsInRegion[A, poly1], 1, If[IsInRegion[B, poly1], 2, If[IsInRegion[C, poly1], 3, If[IsInRegion[D, poly1], 4, If[IsInRegion[E, poly1], 5, If[IsInRegion[F, poly1], 6, If[IsInRegion[G, poly1], 7, If[IsInRegion[H, poly1], 8, If[IsInRegion[I, poly1], 9, 0]]]]]]]]) → x3Sequence(Point[{i + 0.1, 6}], i, -3, 5) → anchorsSegment((1.1, -0.2), (1.1, 4)) → fPoint({8, -2}) → fakeOriginSequence(Segment[fakeOrigin + ((gridSpacer * i), 0), fakeOrigin + ((gridSpacer * i), (10 * gridSpacer))], i, 1, 10) → verLinesSequence(Segment[fakeOrigin + (0, (gridSpacer * i)), fakeOrigin + ((gridSpacer * 10), (i * gridSpacer))], i, 1, 10) → horLinesVector(fakeOrigin, fakeOrigin + ((11 * gridSpacer), 0)) → xaxisVector(fakeOrigin, fakeOrigin + (0, (11 * gridSpacer))) → yaxisJoin({Sequence[(fakeOrigin * (1 - i / 300)) + ((x(point2anchor), y(fakeOrigin)) * i / 300), i, 0, 300], Sequence[((x(point2anchor), y(fakeOrigin)) * (1 - i / 300)) + (point2anchor * i / 300), i, 0, 300]}) → path2Element(path2, timer2) → mover2AreCollinear(point1anchor, point2anchor, point3anchor) → linePolygon((-0.3, -0.3), (2.5, -0.3), (2.5, 3.2), (-0.3, 3.2)) → region, h, i, j, kJoin({Sequence[(fakeOrigin * (1 - i / 300)) + ((x(point3anchor), y(fakeOrigin)) * i / 300), i, 0, 300], Sequence[((x(point3anchor), y(fakeOrigin)) * (1 - i / 300)) + (point3anchor * i / 300), i, 0, 300]}) → path3Element(path3, timer3) → mover3Join({Sequence[(fakeOrigin * (1 - i / 300)) + ((x(point1anchor), y(fakeOrigin)) * i / 300), i, 0, 300], Sequence[((x(point1anchor), y(fakeOrigin)) * (1 - i / 300)) + (point1anchor * i / 300), i, 0, 300]}) → path1Element(path1, timer1) → mover1If(¬firstCheck, Line[mover1, mover2], Line[newMover1, newMover2]) → gPoint({x(fakeOrigin) - gridSpacer, g(x(fakeOrigin) - gridSpacer)}) → leftBoundPoint({x(fakeOrigin) + (11 * gridSpacer), g(x(fakeOrigin) + (11 * gridSpacer))}) → rightBoundIf(¬firstCheck, Vector[mover1, leftBound], Vector[newMover1, leftBound]) → uIf(¬firstCheck, Vector[mover1, rightBound], Vector[newMover1, rightBound]) → vIf(¬firstCheck, timer3 ≟ Length[path3], checkedTimer ≟ 1) → ready
AI Drawing Prompt Reference
Draw a coordinate plane with grid lines and axes. Place three draggable anchor points on the grid, which determine a line. From the origin, draw paths to each anchor, with moving points along them. Based on whether the three anchors are collinear, show either a single line or two connecting segments. Overlay nine labeled points on the grid to detect their grid regions, outputting row and column indices. The whole figure demonstrates graphing a line via a table of values and verifying collinearity.
The prompt above was compiled from the original drawing commands and is for reference only.