
Graphical Solution of Simultaneous Linear and Quadratic Equations
Loading the math board and drawing, please wait…
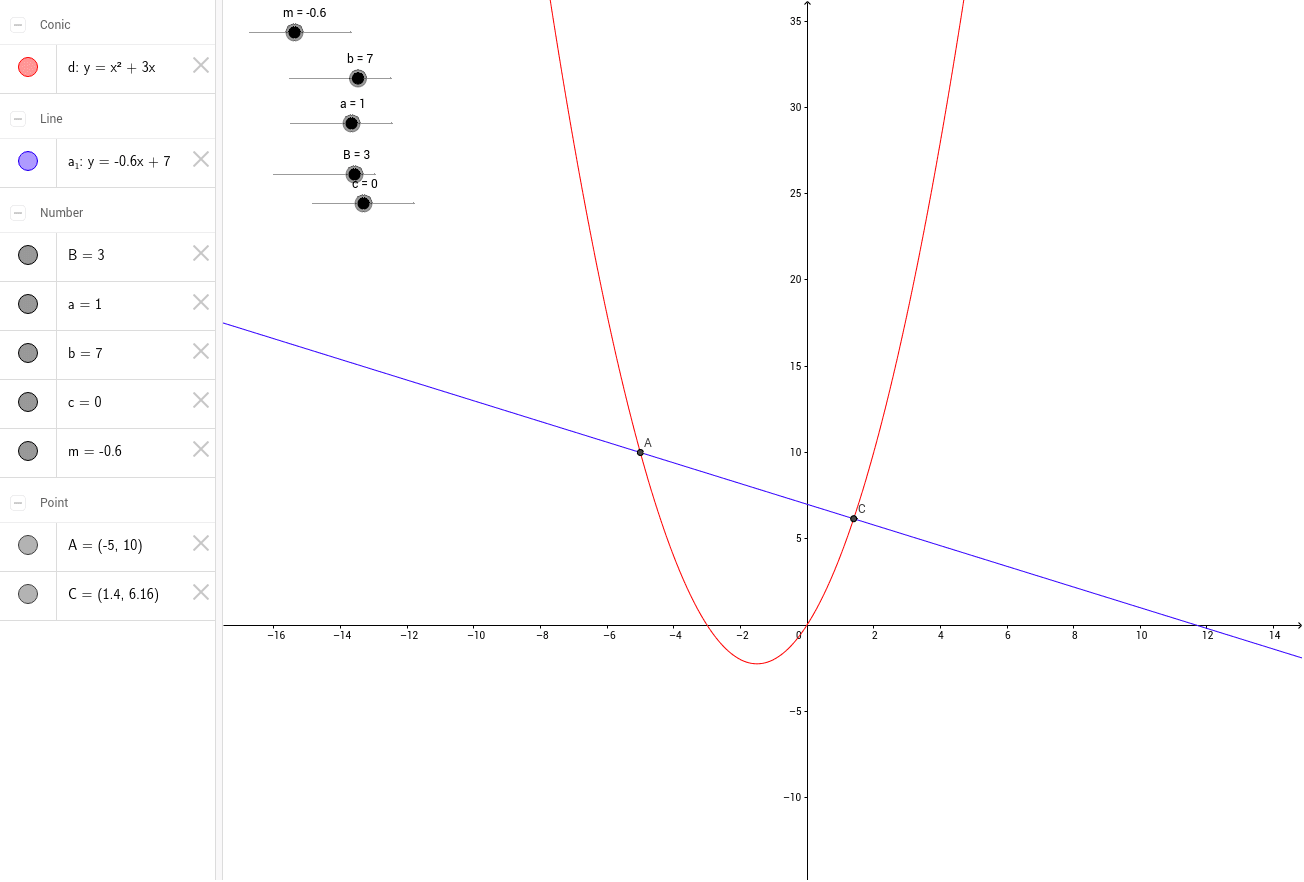
This GeoGebra example demonstrates the graphical solution of a system consisting of a linear equation and a quadratic equation by plotting a straight line and a parabola on the same coordinate plane and identifying their intersection points. Core mathematical concepts include quadratic functions, linear functions, simultaneous equations, coordinate geometry, and the correspondence between algebraic solutions and graph intersections. The construction relies on the GeoGebra Intersect command applied to objects m, b, a₁, a, B, c, d, A, and C, enabling dynamic visualization of how the line and curve meet. It is suitable for middle and high school mathematics instruction, particularly algebra and analytic geometry courses, and can be used for classroom demonstrations, student exploration, or homework practice to reinforce the concept that solutions to simultaneous equations correspond to intersection points of their graphs.
GeoGebra Commands & Parameters
Intersect(d, a_1, 2) → AIntersect(d, a_1, 1) → C
AI Drawing Prompt Reference
Draw a coordinate plane with a straight line and a parabola intersecting at two distinct points. The line represents a linear equation, and the parabola represents a quadratic equation. Their intersections correspond to the solutions of the simultaneous equations. First sketch the parabola, then draw the line crossing it at two points. Clearly mark both intersection points to show where the algebraic solutions meet graphically.
The prompt above was compiled from the original drawing commands and is for reference only.