
Boxplot of Oscar-Winning Male and Female Actors' Ages
Loading the math board and drawing, please wait…
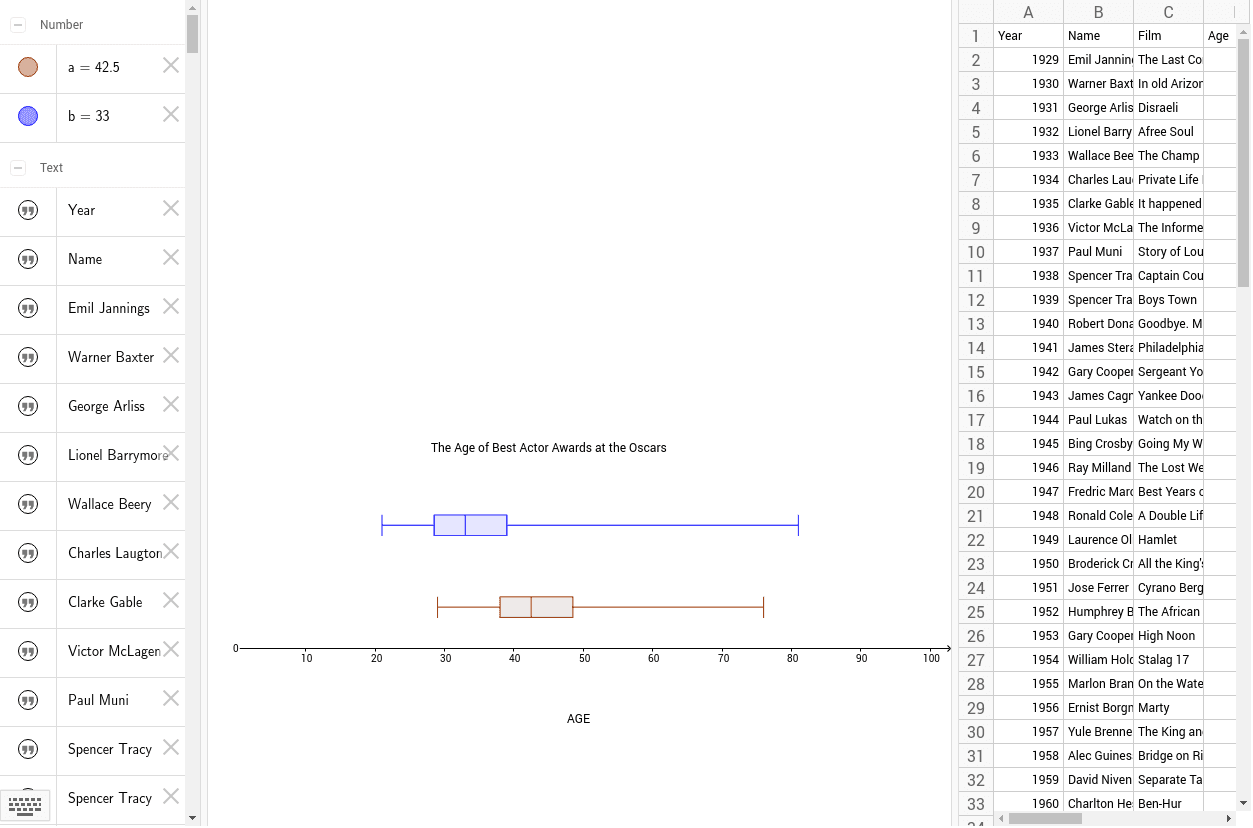
This GeoGebra example demonstrates side-by-side boxplots comparing the ages of Oscar-winning male and female actors. It visualizes key descriptive statistics—median, quartiles, interquartile range, whiskers, and potential outliers—for each gender group. Core mathematical concepts include data distribution, descriptive statistics, and graphical representation of univariate data. The construction relies on the GeoGebra BoxPlot command applied to a series of data-point objects (A1 through D10 and related pairs), plotting multiple boxplots on a shared coordinate plane for direct comparison. Suitable for high school statistics and probability courses or introductory college statistics classes, this resource supports teaching data comparison, outlier detection, and interpretation of box-and-whisker diagrams.
GeoGebra Commands & Parameters
BoxPlot(2, 0.5, D2:D85) → aBoxPlot(6, 0.5, I2:I85) → b
AI Drawing Prompt Reference
Please draw two side-by-side boxplots to compare the ages of Oscar-winning male and female actors. Each boxplot should display age data, including the median, quartiles, box, whiskers, and potential outliers. The two boxplots should share the same coordinate plane for direct comparison. The construction order is to first draw one boxplot, then draw the other.
The prompt above was compiled from the original drawing commands and is for reference only.