
Graphical Limits Quiz
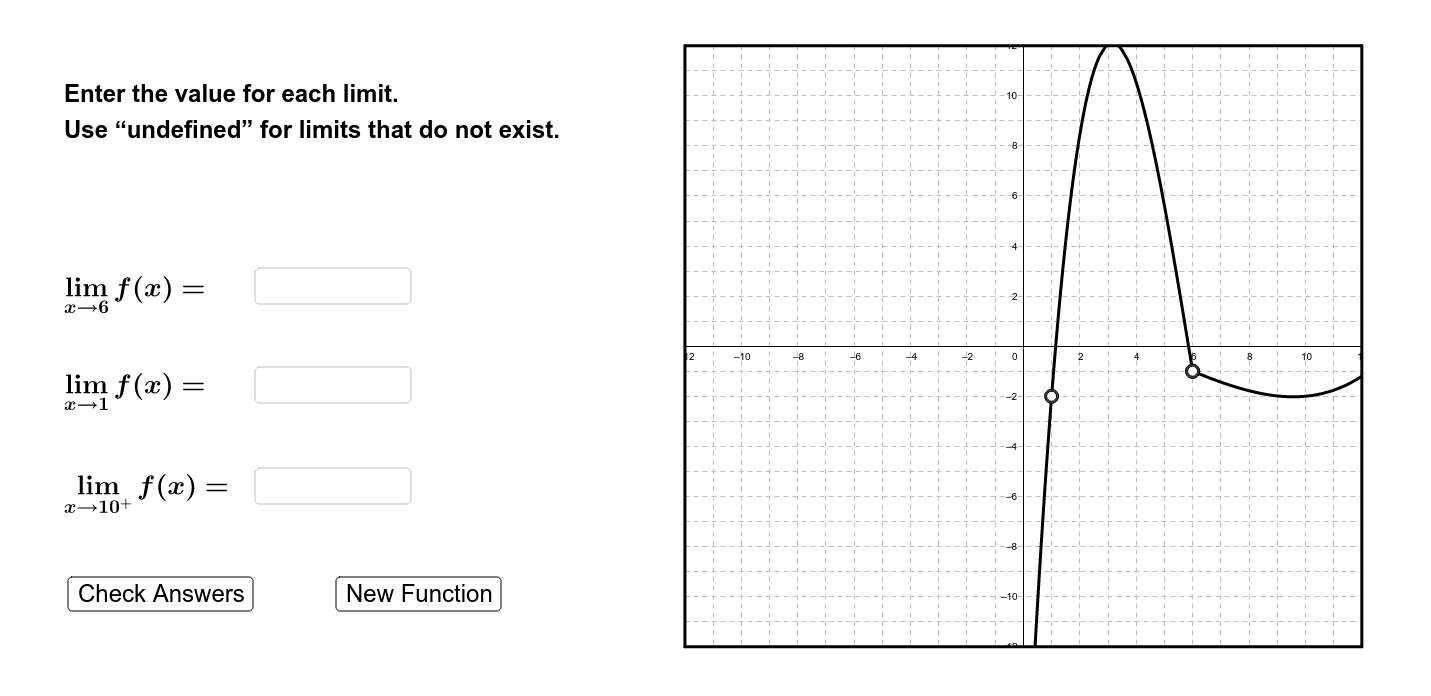
Loading the math board and drawing, please wait…
This example demonstrates visually understanding and practicing the concept of limits through graphical methods. Core math concepts include limits, function graphs, random experiments, histograms, and distributions. It uses GeoGebra commands and objects like Random (random number generation), If (conditional statements), Polynomial (polynomial functions), Textfield (text input), and Polygon (polygon drawing). Suitable for high school and above students learning calculus to assist in understanding and mastering limit calculations.
GeoGebra Commands & Parameters
Random(-10, 10) → x_ARandom(1, 10) → typeRandom(-10, 10) → seed_BIf(seed_B ≟ x_A, (-x_A), seed_B) → x_BIf(type ≤ 3, x_A, If[type ≥ 8, x_B, Random[-5, 5]]) → breakIf((type > 1) ∧ (type < 9), break, Random[-10, 10]) → x_CPolynomial({(x_A, Random[-5, 5]), (x_B, Random[-3, 8]), (If[x_C ≟ x_A ∨ x_C ≟ x_B, -21, x_C], Random[-10, 10]), (Random[10, 20], Random[10, 20])}) → fPolynomial({(x_A, Random[-2, 10]), (x_B, Random[-6, 3]), (If[x_C ≟ x_A ∨ x_C ≟ x_B, 21, x_C], Random[-10, 10]), (Random[-20, -11], Random[-20, 20]), (Random[11, 20], Random[-20, 20])}) → gRandom(0, 1) → leftIf(x_A < break, Limit[f, x_A], If[x_A > break, Limit[g, x_A], If[f(x_A) ≟ g(x_A), f(x_A), -1000]]) → lim_AIf(type > 5, x_A, If[type < 5, x_B, Random[-5, 5]]) → holeXIf(x_B < break, Limit[f, x_B], If[x_B > break, Limit[g, x_B], If[f(x_B) ≟ g(x_B), f(x_B), -1000]]) → lim_BTextfield(guessA) → guessABoxTextfield(guessB) → guessBBoxRandom(0, 1) → rightIf(x_C ≟ break, If[right ≟ 0, f(x_C), g(x_C)], If[x_C < break, f(x_C), g(x_C)]) → lim_CTextfield(guessC) → guessCBoxPolygon((-12, -12), (-12, 12), (12, 12), (12, -12)) → poly1, a, b, c, dPolygon((-12, -12), (-12, 12), (12, 12), (12, -12)) → poly2, e, i, j, k