
Graphical Limits Demo
Loading the math board and drawing, please wait…
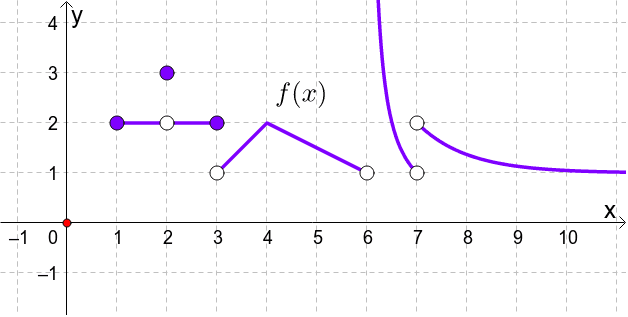
This example demonstrates the concept of limits graphically, involving function graphs, geometric transformations, and key GeoGebra commands like Point and Vector. Ideal for high school mathematics education or self-study to understand the geometric meaning of limits.
GeoGebra Commands & Parameters
Point(xAxis) → DVector((x(D), 0), (x(D), f(x(D)))) → uVector((x(D), f(x(D))), (0, f(x(D)))) → v
AI Drawing Prompt Reference
Draw a function graph and mark a point on the x-axis. From this point, draw a vector to the function graph and another vector from the point on the graph to the y-axis to show the local change trend of the function at a point, demonstrating the concept of limits.
The prompt above was compiled from the original drawing commands and is for reference only.