
Graphical Limits Concept
Loading the math board and drawing, please wait…
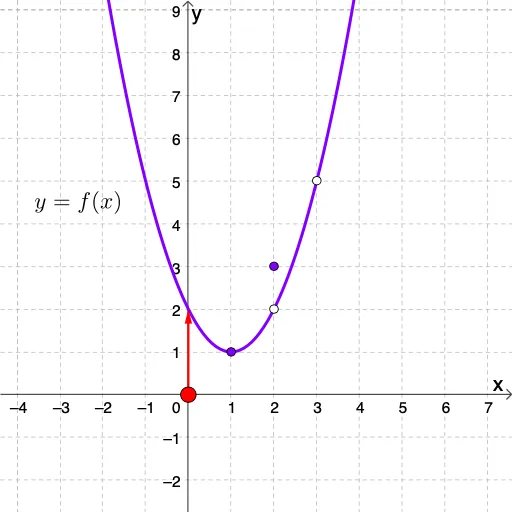
This applet demonstrates the concept of limits graphically. It involves the limits of functions, and by dynamically adjusting function parameters, one can observe the formation of limits visually. The construction uses points, vectors, and functions in GeoGebra. Suitable for high school mathematics education and learning about limits.
GeoGebra Commands & Parameters
Point(xAxis) → DVector((x(D), 0), (x(D), f(x(D)))) → uVector((x(D), f(x(D))), (0, f(x(D)))) → v
AI Drawing Prompt Reference
On a coordinate plane, include a horizontal reference line as the x-axis. Choose a point D located on the x-axis so it has coordinates (x(D),0). From the point (x(D),0), draw a directed segment (vector u) pointing to (x(D), f(x(D))). Then at the point (x(D), f(x(D))), draw another directed segment (vector v) pointing to (0, f(x(D))). Make the two vectors meet at (x(D), f(x(D))) so they form a clear two-part vector construction based on the height f(x(D)).
The prompt above was compiled from the original drawing commands and is for reference only.