
Graphical Integer Addition and Subtraction
Loading the math board and drawing, please wait…
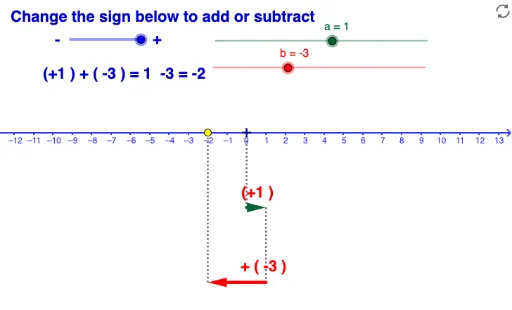
This example demonstrates the process of adding and subtracting integers graphically. It involves core mathematical concepts such as integer operations, vectors, and geometric transformations. The construction utilizes GeoGebra commands and objects like Line, Vector, OrthogonalLine, Intersect, Segment, Mirror, Midpoint, and If. It is suitable for middle school and above students to understand the geometric meaning of integer operations and for mathematical teaching demonstrations.
GeoGebra Commands & Parameters
Line(C, xAxis) → dVector(B, D) → uVector(C, E) → vOrthogonalLine(E, xAxis) → eIntersect(e, xAxis) → FSegment(E, F) → fSegment(D, C) → gSegment(A, B) → hMirror(E, C) → E'Vector(C, E') → wMidpoint(E, C) → GMidpoint(D, B) → HIf(signo < 0, "-", "+") → TextoSignoIf(a > 0, "+", " ") → TextoSignoaIf(b > 0, "+", " ") → TextoSignobIf(b2 ≥ 0, "+", " ") → TextoSignob2