
Graphical Exploration of Limits
Loading the math board and drawing, please wait…
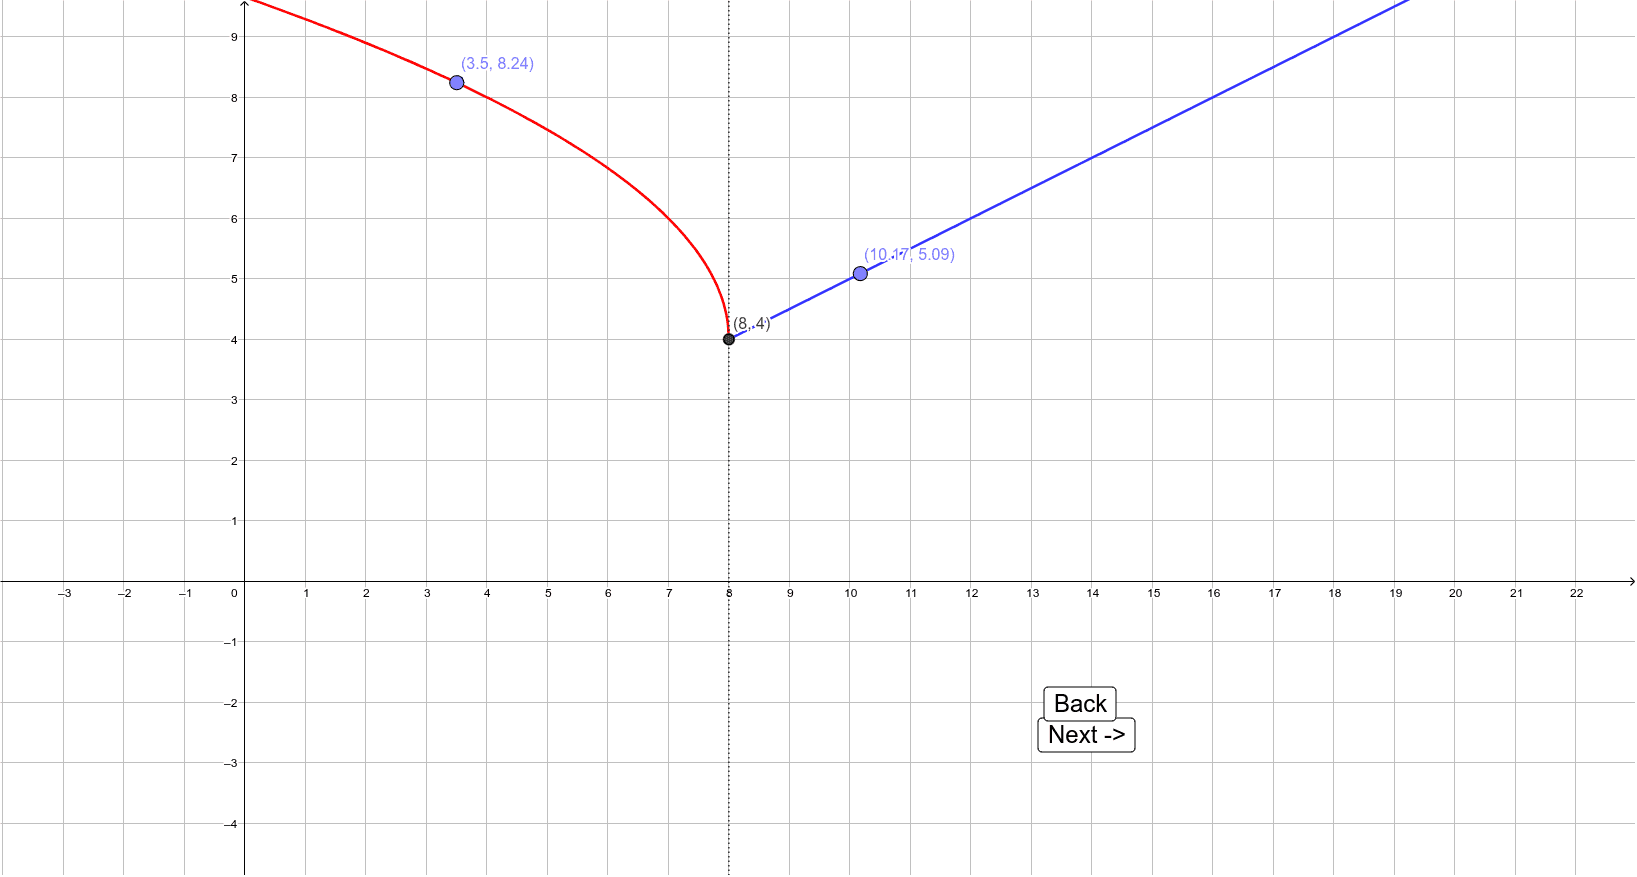
This example demonstrates the concept and properties of limits through graphical exploration. It involves core mathematical concepts such as limits, derivatives, angles, hypergeometric distribution, and rectangles. The construction uses GeoGebra commands like CurveCartesian for plotting curves and Point for creating points, along with interactive elements like sliders and buttons (b, a, c, A, B, h, button1, button2, C, D). Suitable for high school and above, it helps understand the geometric meaning of limits and derivatives, and the dynamic changes in parametric graphs.
GeoGebra Commands & Parameters
CurveCartesian(t, f(t), t, -1000, b) → aCurveCartesian(t, g(t), t, b, 1000) → cPoint(a) → CPoint(c) → D