
Animating the Derivative via the Limit Definition
Loading the math board and drawing, please wait…
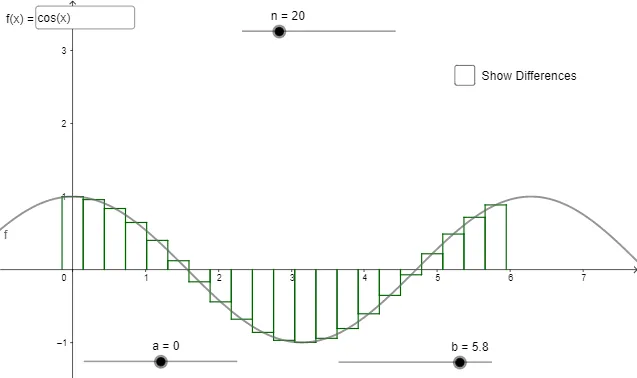
This example visualizes the derivative by animating how the tangent slope emerges from the limit definition. It demonstrates the idea that the derivative at a point equals the limit of the secant-line slopes as the two points on the curve get arbitrarily close. Key concepts include the derivative as a limit, the difference quotient, secant-to-tangent convergence, and slope computation on function graphs (often illustrated using simple curves such as a parabola). Construction-wise, the GeoGebra build uses commands and objects to generate moving points and parameters (via Sequence and parameter-driven variables), draw the relevant lines (Line), and compute slopes (Slope) to form the animated relationship between secant slopes and the derivative. Textfield/InputBox elements and annotation objects (text1, text2, drv-related labels) are used to display the mathematical expressions while the animation updates. The setup includes dynamic elements (e.g., Rotate and the grouped bar/indicator objects like Bars_{...}) to emphasize the limiting process. Suitable for high school to early university calculus instruction, especially for explaining the geometric meaning of the derivative and how the limit definition produces the tangent line behavior.
GeoGebra Commands & Parameters
Sequence(Segment[(a + (d * i), f(a + (d * i))), (a + (d * (i - 1)), f(a + (d * i)))], i, 1, n) → Bars_{HR}Sequence(Segment[(a + (d * (i - 1)), f(a + (d * i))), (a + (d * (i - 1)), 0)], i, 1, n) → Bars_{R1}Sequence(Segment[(a + (d * i), f(a + (d * i))), (a + (d * i), 0)], i, 1, n) → Bars_{R2}Sequence(Segment[(a + (d * i), f(a + (d * i))), (a + (d * (i + 1)), f(a + (d * i)))], i, 0, n - 1) → Bars_{HL}Sequence(Segment[(a + (d * (i + 1)), f(a + (d * i))), (a + (d * (i + 1)), 0)], i, 0, n - 1) → Bars_{L1}Sequence(Segment[(a + (d * i), f(a + (d * i))), (a + (d * i), 0)], i, 0, n - 1) → Bars_{L2}Sequence(Segment[(a - d / 2 + (d * i), f(a + (d * i))), (a - d / 2 + (d * i), 0)], i, 0, n) → Bars_{M1}Sequence(Segment[(a - d / 2 + (d * i), f(a + (d * i))), (a + d / 2 + (d * i), f(a + (d * i)))], i, 0, n) → Bars_{HM}Sequence(Segment[(a + d / 2 + (d * i), f(a + (d * i))), (a + d / 2 + (d * i), 0)], i, 0, n) → Bars_{M2}Textfield(f) → InputBox1Sequence(Segment[(a + d / 2 + (d * i), (s * f(a + (d * i)))), (a + d / 2 + (d * i), (s * f(a + (d * i))) + f(a + (d * (i + 1))) - f(a + (d * i)))], i, 0, n - 1) → l1Sequence(Segment[(a + d / 2 + (d * i), (s * f(a + (d * i)))), (a + d / 2 + (d * i), (s * f(a + (d * i))) + (t / d * (f(a + (d * (i + 1))) - f(a + (d * i)))))], i, 0, n - 1) → drv_{M}Line(P_{1}, P_{2}) → iSlope(i) → jElement(drv_{M}, m) → k
AI Drawing Prompt Reference
Draw a function curve and animate the limit definition of its derivative. Place a moving point on the curve, with a slider controlling its position and the distance to a second point. As the two points approach each other, the secant line through them changes slope, converging to the tangent slope. Use vertical and horizontal segments to form rectangular bars that visualize function value differences, and dynamic segments to represent the difference quotient and derivative approximation. Include an input box to edit the function expression, and display the mathematical formulas and slope values. Emphasize the limiting process from secant to tangent.
The prompt above was compiled from the original drawing commands and is for reference only.