
Graphical Exploration of Function Composition and Continuity
Loading the math board and drawing, please wait…
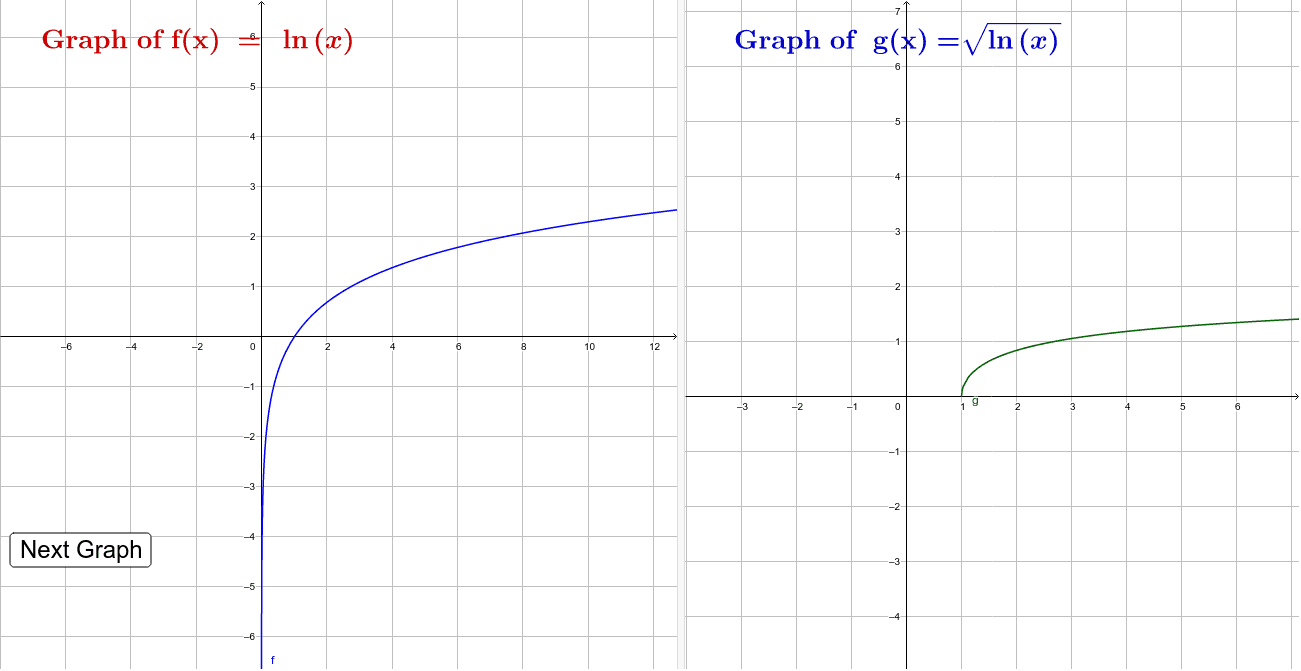
This example demonstrates continuity under function composition, particularly with the square root function, through graphical means. Key math concepts include function composition, continuity assessment, and square root function properties. It is constructed using GeoGebra commands like RandomElement and involves objects such as button1, variables a, c, b, functions f, g, and text elements text1, text2. Suitable for high school and above, it aids in understanding the graphical relationship between function continuity and composite functions, enhancing intuitive comprehension.
GeoGebra Commands & Parameters
RandomElement({-1, 1, 2, -2}) → aRandomElement({-2, 0, 1}) → cRandomElement({-3, 2, 1, 0}) → bRandomElement({x, Simplify[(a * x^(2)) + (b * x) + c], sin(x), cos(x), log(x), ℯ^(x)}) → f
AI Drawing Prompt Reference
Create a graphical demonstration of continuity under function composition, featuring randomly generated square root and linear functions. Compare their continuity visually. Generate three random parameters first, then create two functions: one being a square root function and the other randomly selected from specified types. Plot the graphs of these functions, labeling key parameter values to illustrate the continuity of the composite function.
The prompt above was compiled from the original drawing commands and is for reference only.