
Graphical Derivative Calculation
Loading the math board and drawing, please wait…
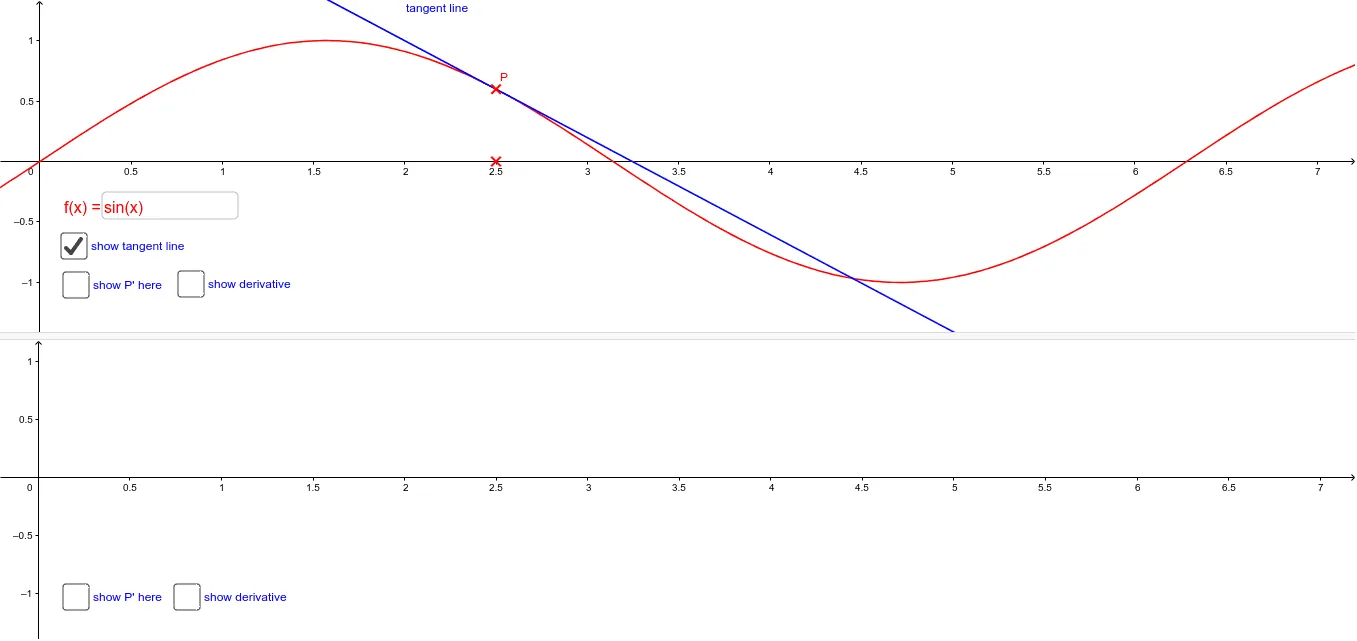
This example demonstrates the calculation of a function's derivative at a point using graphical methods. Key math concepts include the geometric interpretation of derivatives (tangent slope) and coordinate geometry. Construction highlights the use of GeoGebra commands and objects like Point, Tangent, Slope, Locus, and Textfield to dynamically visualize the change in tangent and slope, intuitively illustrating the concept of derivatives. Suitable for high school and above students learning basic calculus concepts.
GeoGebra Commands & Parameters
Point(xAxis) → X_0Tangent(P, f) → tangentSlope(tangent) → mLocus(P'Above, X_0) → graphAboveLocus(P'Below, X_0) → graphBelowTextfield(f) → InputBox1
AI Drawing Prompt Reference
Draw the graph of a function f(x) and select a point X_0 on the x-axis. Draw the tangent line tangent to the function f(x) at point X_0 and calculate its slope m. Then draw two lines with slope m above and below X_0, named graphAbove and graphBelow, to illustrate the concept of derivatives.
The prompt above was compiled from the original drawing commands and is for reference only.