
Graph Translation by mdeveaux
Loading the math board and drawing, please wait…
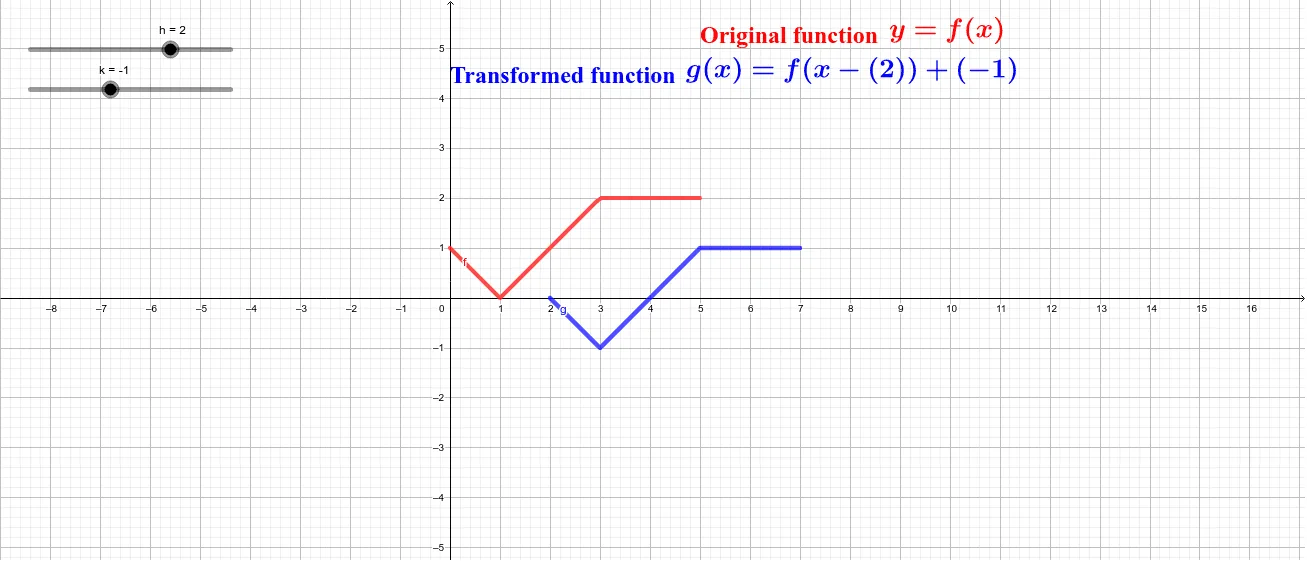
This example demonstrates the translation transformation of a graph. Key mathematical concepts include translation vectors and coordinate transformations. By using GeoGebra commands to construct the translation, one can observe the changes in the graph after the transformation. Suitable for students at the junior high school level and above to learn about geometric transformations.
GeoGebra Commands & Parameters
f(x) = If[0 < x < 1, (-x) + 1, If[1 < x < 3, x - 1, If[3 < x < 5, 2]]]Numeric h(2.0)Numeric k(-1.0)g(x) = f(x - h) + k
AI Drawing Prompt Reference
Draw the graph of a piecewise function with three parts: y=-x+1 for x in (0,1), y=x-1 for x in (1,3), and y=2 for x in (3,5). Then, translate this graph 2 units to the right along the x-axis and 1 unit up along the y-axis to create a new graph. Finally, plot both graphs on the same coordinate system to illustrate the effect of the translation transformation.
The prompt above was compiled from the original drawing commands and is for reference only.