
Graph of a Quadratic Function
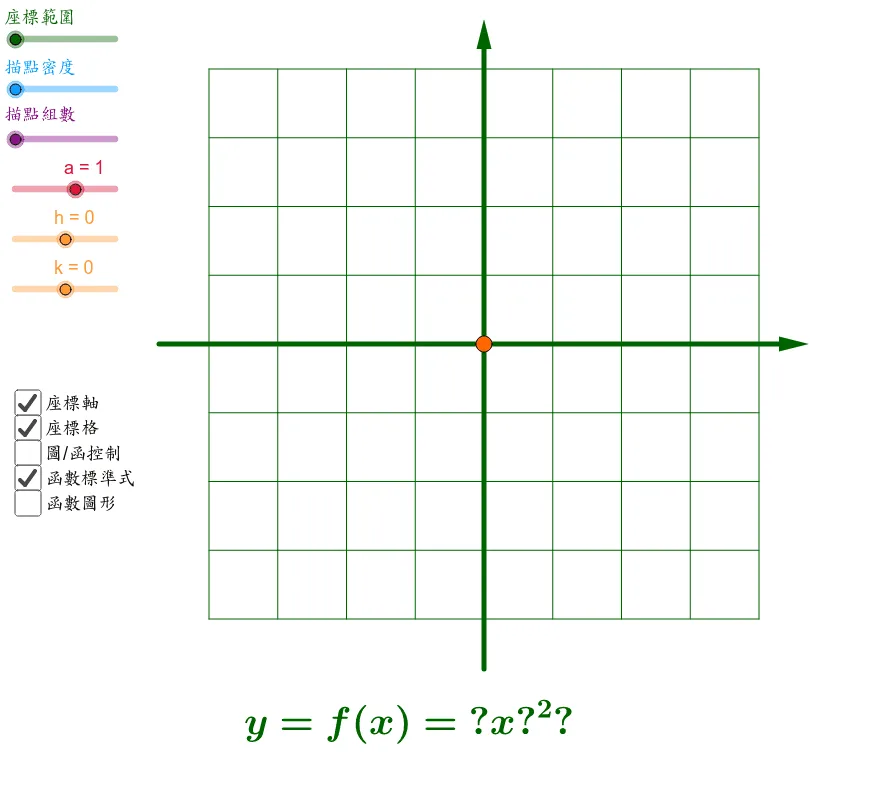
This example demonstrates the development of the graph of a quadratic function from plotting points to the standard form. Key mathematical concepts include quadratic functions, linear functions, and arithmetic operations. Using GeoGebra commands such as XY axis, grid lines, points, and value points, it helps students understand the properties of quadratic functions. Suitable for students from middle school and above.
Loading the math board and drawing, please wait…