
Gradient of a Straight Line
Loading the math board and drawing, please wait…
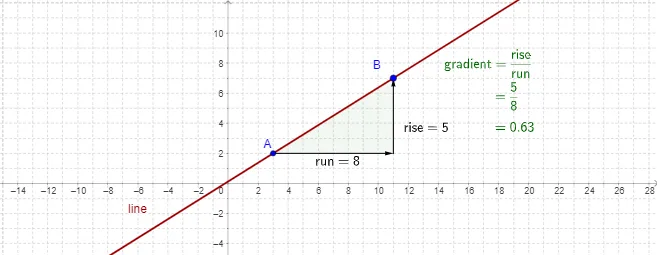
This GeoGebra example provides an interactive visual demonstration of the gradient (slope) of a straight line and its geometric interpretation. The core mathematical concept is the slope of a linear function, defined as the ratio of vertical change to horizontal change between two points on the line, along with related coordinate geometry topics such as linear equations, midpoints, and perpendicular lines. The construction uses GeoGebra commands including Line to draw the line, Slope to display its gradient value, OrthogonalLine to create perpendiculars, Intersect to find intersection points, Polygon to form auxiliary triangles, Midpoint to locate midpoints, and Vector to represent direction. Dynamic points A, B, and P allow users to drag and adjust the line, observing how the slope changes in real time. This resource is suitable for middle and high school students learning linear functions and coordinate geometry, and serves as an effective classroom demonstration tool for teachers to illustrate the relationship between slope and line inclination.
GeoGebra Commands & Parameters
OrthogonalLine(B, xAxis) → b_1OrthogonalLine(A, yAxis) → cIntersect(b_1, c) → CPolygon(A, C, B) → P, w, h, c_1Line(A, B) → lineSlope(line) → slopeMidpoint(C, B) → DMidpoint(A, C) → EVector(F, B) → vVector(A, F) → u
AI Drawing Prompt Reference
Draw a straight line and display its slope value. Construct two perpendicular lines to the coordinate axes from any two points on the line and find their intersection. Form a triangle using these three points and calculate its area and midpoints. Also, draw vectors from the midpoints to the endpoints of the line, representing direction. Drag points on the line to observe changes in the slope value and other elements.
The prompt above was compiled from the original drawing commands and is for reference only.