
Gradient-Intercept Form Exploration
Loading the math board and drawing, please wait…
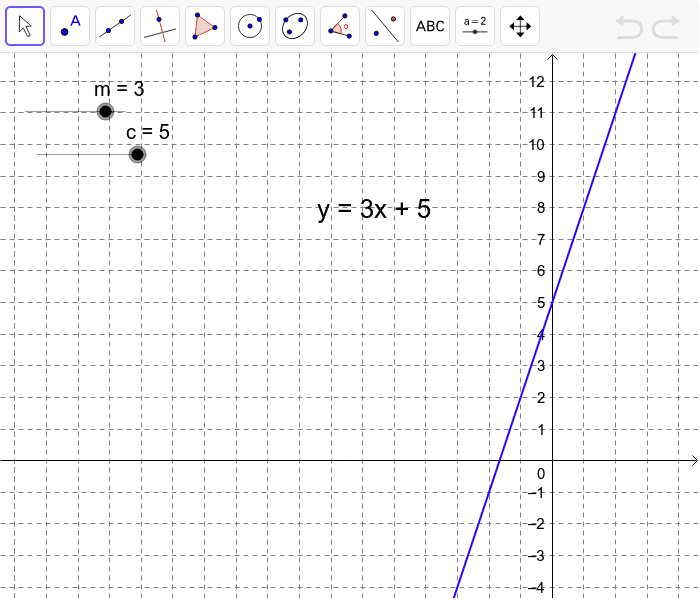
This example demonstrates the effect of changing m and c on the graph of a linear equation. It covers the core concept of the gradient-intercept form, including slope and y-intercept. Constructed using GeoGebra commands, including slider animation. Suitable for middle school and above students learning linear equations.
GeoGebra Commands & Parameters
Numeric m(3)Numeric c(5)y = (m * x) + cLine c_1(-4, 1, 0)Line d(-0.25, 1, 0)Line e(1, 1, 0)
AI Drawing Prompt Reference
Draw a line with a slope of 3 and y-intercept of 5. Then, create two new lines with slopes of -0.25 and 1, respectively, both passing through the point (0,1). Observe how these lines affect the graph.
The prompt above was compiled from the original drawing commands and is for reference only.