
Gradient Function of a Parabola (Tangent Slope Demo)
Loading the math board and drawing, please wait…
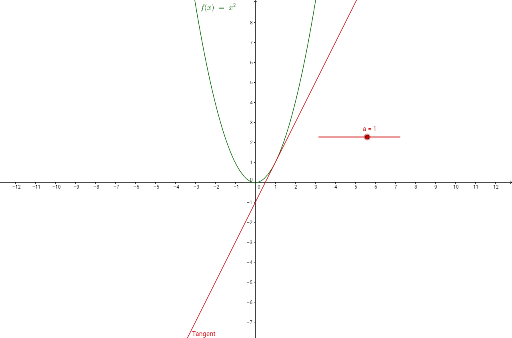
① This example dynamically demonstrates how the slope of the tangent line to a parabola changes as a point moves along the curve, and simultaneously plots the corresponding gradient (derivative) function. ② Core mathematical concepts include quadratic functions, derivatives, tangent lines, and the relationship between a function and its derivative graph. ③ Construction highlights: using GeoGebra objects f (the parabola), a (a draggable point or parameter), and Tangent (the tangent command) to create the tangent line, then tracing the slope to generate the derivative curve. ④ Suitable for high school or early college students learning introductory calculus, ideal for classroom demonstrations or self-guided exploration of derivative concepts, and useful for teachers creating interactive materials.
GeoGebra Commands & Parameters
f(x) = x^(2)Numeric a(1)Tangent(x) = (2 * (a * x)) - a^(2)
AI Drawing Prompt Reference
Draw a parabola opening upwards, then drag a point on the parabola to show the tangent line at that point and plot the dynamic change of the tangent slope, ultimately generating the graph of the derivative function. First, draw the parabola y=x^2, then use the tangent command to draw the tangent line at a draggable point a on the parabola, and finally trace the slope of the tangent line to generate the graph of the derivative function.
The prompt above was compiled from the original drawing commands and is for reference only.