
Gradient and Slope Demonstration
Loading the math board and drawing, please wait…
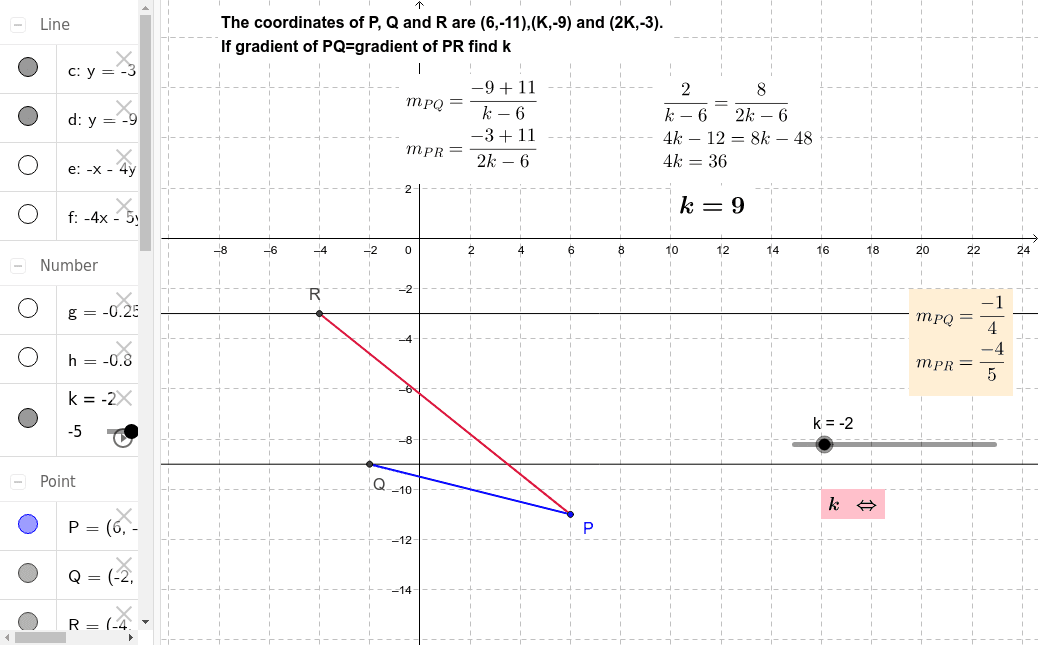
This example visually demonstrates gradients and slopes in a coordinate system. It involves core mathematical concepts like slope calculation, linear equations, special points marking, scatter plots, cosine functions, step functions, and histograms. Construction highlights include commands for segments, lines, and slope calculations, along with objects like P, k, Q, R, and text elements. Suitable for high school mathematics education to help students understand the geometric meaning of function graphs and the basics of data analysis.
GeoGebra Commands & Parameters
Segment(R, P) → aSegment(P, Q) → bLine(P, Q) → eLine(P, R) → fSlope(e) → gSlope(f) → h
AI Drawing Prompt Reference
In a coordinate system, draw a line segment connecting point R to point P, and another connecting point P to point Q to form triangle PQR. Draw two lines through points P and R, making them parallel to line segment PQ and PR respectively. Calculate and display the slopes of these two lines in different colors. Label the key points and lines in the coordinate system, and show the slope values to demonstrate the concepts of gradients and slopes.
The prompt above was compiled from the original drawing commands and is for reference only.