
Golden Gate Bridge Parabola
Loading the math board and drawing, please wait…
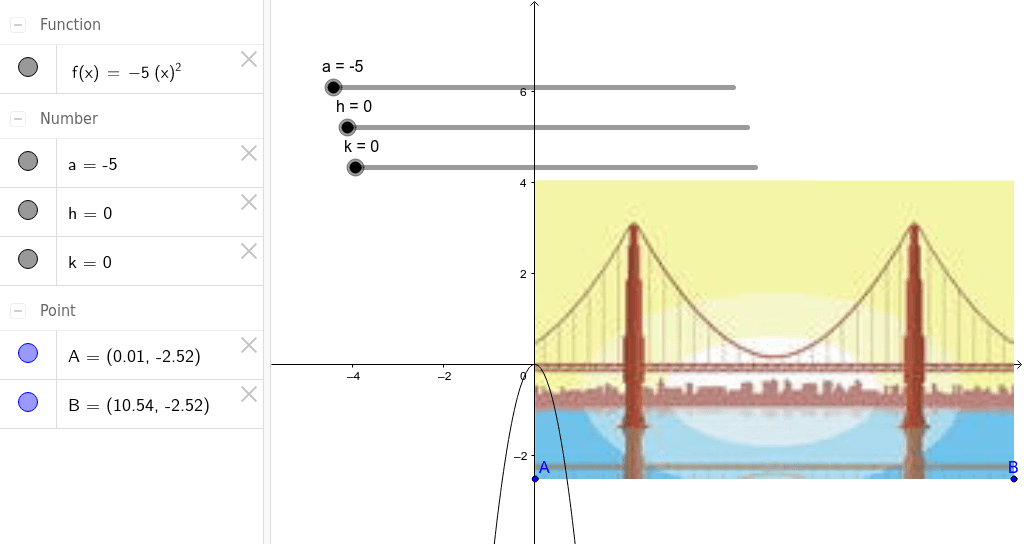
This example demonstrates how to graph the parabola of the Golden Gate Bridge using GeoGebra, showcasing its geometric properties. Core math concepts include parabola, quadratic equations, differential calculus, and percentage calculations. Construction highlights involve GeoGebra objects A, B, pic1, a, h, k, f, where a, h, k control parabola parameters, and pic1 displays the image. Suitable for high school mathematics education to understand parabolic equations and their applications.
GeoGebra Commands & Parameters
Point A(0.01, -2.52)Point B(10.544, -2.522)Numeric a(-5)Numeric h(0)Numeric k(0)f(x) = (a * (x - h)^(2)) + k
AI Drawing Prompt Reference
Draw the parabola of the Golden Gate Bridge. Place points A and B on the coordinate axis, with A at (0.01, -2.52) and B at (10.544, -2.522). Set parameter a to -5, h to 0, and k to 0. Then, draw the parabola f(x) = a * (x - h)^2 + k based on these parameters.
The prompt above was compiled from the original drawing commands and is for reference only.