
Synthetic Division Demo by Yip Wing Chung, Felix
Loading the math board and drawing, please wait…
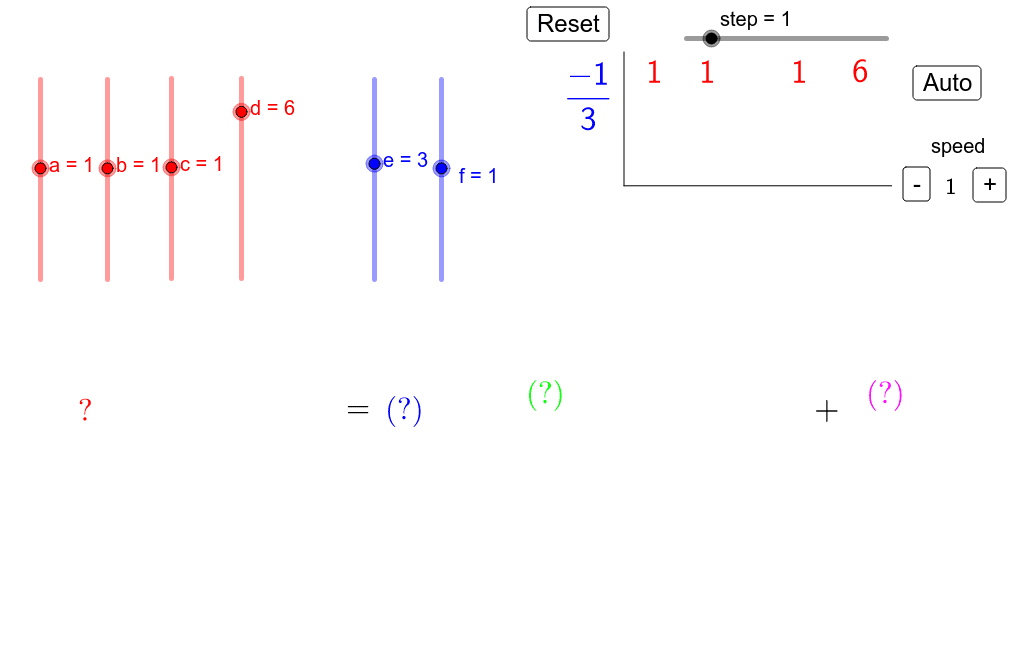
This example demonstrates the process of simplifying polynomials using synthetic division. It involves core mathematical concepts such as polynomial division, remainder theorem, and synthetic division algorithm. Constructed with GeoGebra commands like LaTeX, FractionText, Vector, Text, Segment, and objects including a, b, c, d, e, f, text1 to text8, result, res, text11, A to M, seg1, seg2 for visualizing and interacting with polynomials and their results. Suitable for high school and above mathematics learners to understand polynomial division applications and visualization.
GeoGebra Commands & Parameters
LaTeX($1) → text1LaTeX($2) → text2LaTeX($3) → text4LaTeX($1) → text7FractionText(result) → resLaTeX($4) → text11Vector(A, B) → uText(a, C) → text15Segment(K, L) → seg1Segment(M, L) → seg2FractionText(a) → text10FractionText(h) → text19FractionText(i) → text20FractionText(j) → text23FractionText(k) → text24FractionText(l) → text25FractionText(m) → text26FractionText(g) → text27FractionText(test) → text28FractionText(result) → text30Text(a_1, C_2) → text15_1FractionText(speed) → text33
AI Drawing Prompt Reference
Create a visual demonstration of polynomial synthetic division. Show the dividend and divisor as fraction texts at the top, with a vector arrow connecting two points to indicate the division process. Below, display multiple intermediate coefficients and the result as fraction texts, each labeled near its corresponding position. Use two line segments connecting three points to form a triangular or auxiliary structure that helps visualize the steps. The overall layout should clearly highlight the relationship between coefficients, remainder, and quotient, suitable for educational demonstration.
The prompt above was compiled from the original drawing commands and is for reference only.